 noahmagill.com
 Tetragon Without Kubernetes: Process and Network Events from EC2 to ClickHouse
Unbeknownst to most, Tetragon can be run on a regular Linux-based host without a container environment present. The instructions are more-or-less located here.
This comes with all sorts of exciting possibilities for observability and security on standalone EC2 instances or other forms of cloud compute.
We currently run tests on stable long-term support kernels 4.19, 5.4, 5.10, 5.15 and bpf-next, see this test workflow for up to date information. Not all Tetragon features work with older kernel versions. BPF evolves rapidly and we recommend you use the most recent stable kernel possible to get the most out of Tetragon’s features. from the Tetragon FAQ
You can check your kernel’s compatibility by running:
tetra probe config
Contents
Data Flow
| Tool | Purpose |
|---|---|
| Tetragon | Execv, network syscall collection |
| Vector | Log shipper / log router |
| Amazon S3 | Object storage for gzip-compressed logs |
| ClickHouse | OLAP database for long-term log storage and querying |
Tetragon Config
Follow the install instructions above and install it as a package. Granted, I’m using Ansible here so my install looks a bit different.
Here is a snippet of my Ansible install:
- name: Install Tetragon daemon configuration
  ansible.builtin.copy:
    dest: "/etc/tetragon/tetragon.conf.d/{{ item.name }}"
    content: "{{ item.value }}\n"
    owner: root
    group: root
    mode: "0644"
  loop:
    - { name: bpf-lib, value: /usr/local/lib/tetragon/bpf/ }
    - { name: enable-k8s-api, value: "false" }
    - { name: enable-process-cred, value: "true" }
    - { name: enable-process-ns, value: "true" }
    - { name: event-queue-size, value: "4096" }
    - { name: execve-map-entries, value: "8192" }
    - { name: export-allowlist, value: '{"event_set":["PROCESS_EXEC","PROCESS_KPROBE"]}' }
    - { name: export-file-max-backups, value: "5" }
    - { name: export-file-max-size-mb, value: "10" }
    - { name: export-file-perm, value: "0640" }
    - { name: export-file-rotation-interval, value: 1h }
    - { name: export-filename, value: "{{ tetragon_log_path }}" }
    - { name: process-cache-size, value: "16384" }
    - { name: rb-queue-size, value: "8192" }
    - { name: server-address, value: "unix:///run/tetragon/tetragon.sock" }
    - { name: username-metadata, value: unix }
  notify: Restart tetragon
Some of these values are probably redundant / default duplicates. One of the downsides of using an LLM to generate your configs for you, lol. For every item in this loop it creates a file in the /etc directory and dumps the value it needs, slightly different than just defining config maps like the Kubernetes install has you do.
Here is the policy that enables socket capturing per process (/etc/tetragon/tetragon.tp.d/arena-network-observability.yaml):
apiVersion: cilium.io/v1alpha1
kind: TracingPolicy
metadata:
  name: arena-network-observability
spec:
  options:
    - name: policy-mode
      value: monitor
  kprobes:
    - call: security_socket_connect
      syscall: false
      tags: ["network", "connect"]
      args:
        - index: 1
          type: sockaddr
          label: remote_address
        - index: 2
          type: int
          label: address_length
      selectors:
        - matchArgs:
            - index: 1
              operator: Family
              values: ["AF_INET", "AF_INET6"]

    - call: security_socket_bind
      syscall: false
      tags: ["network", "bind"]
      args:
        - index: 1
          type: sockaddr
          label: local_address
        - index: 2
          type: int
          label: address_length
      selectors:
        - matchArgs:
            - index: 1
              operator: Family
              values: ["AF_INET", "AF_INET6"]

    - call: inet_csk_listen_start
      syscall: false
      tags: ["network", "listen"]
      args:
        - index: 0
          type: sock
          label: socket

    - call: inet_csk_accept
      syscall: false
      return: true
      tags: ["network", "accept"]
      args:
        - index: 0
          type: sock
          label: listening_socket
      returnArg:
        index: 0
        type: sock
        label: accepted_socket

    - call: tcp_close
      syscall: false
      tags: ["network", "close"]
      args:
        - index: 0
          type: sock
          label: socket
Tetragon allows you to just define eBPF hooks to hook into functions/syscalls. For instance, security_socket_bind is an LSM hook that AppArmor, SELinux, etc. use to allow/deny network creations. In this case, Tetragon can use it to just determine what is opening a socket or not. I’m pretty confident that the list above is not entirely conclusive, and I’m sure it would miss some specific types of network connections, so ensure your list is exhaustive (UDP, etc).
The execv-like captures come from this line in the Ansible block: - { name: export-allowlist, value: '{"event_set":["PROCESS_EXEC","PROCESS_KPROBE"]}' }. This captures a wide variety of syscalls such as execv, fork, etc. See the process execution docs for more.
Vector Config
Vector is a nice tool that works in standalone EC2 or in Kubernetes environments such as EKS. It’s written in Rust and supports dozens if not hundreds of destination outputs to send logs to and from.
Setup guide: vector.dev/docs/setup/installation
Here is an example config I have located at /etc/vector/vector.toml:
data_dir = "/var/lib/vector"

[sources.tetragon_events]
type = "file"
include = ["/var/log/tetragon/tetragon.log"]
read_from = "beginning"
ignore_checkpoints = false

[transforms.arena_context]
type = "remap"
inputs = ["tetragon_events"]
source = '''
parsed = parse_json!(.message)
. = merge!(., parsed)
del(.message)
.arena.environment = "all-current"
.arena.team = "team1"
.arena.service = "mysql"
.arena.instance_id = "i-asdf"
.arena.instance_name = "arena-all-current-mysql-team1-mysql-fe16821b"
'''

[sinks.exec_s3]
type = "aws_s3"
inputs = ["arena_context"]
bucket = "arena-score-archive-111111111-us-east-1"
region = "us-east-1"
endpoint = "https://s3.dualstack.us-east-1.amazonaws.com"
force_path_style = true
key_prefix = "telemetry/environments/all-current/team1/service=mysql/instance=i-asdf/date=%F/hour=%H/"
compression = "gzip"
server_side_encryption = "aws:kms"
ssekms_key_id = "arn:aws:kms:us-east-1:111111111:key/asdf"

[sinks.exec_s3.encoding]
codec = "json"

[sinks.exec_s3.framing]
method = "newline_delimited"

[sinks.exec_s3.batch]
max_bytes = 1048576
timeout_secs = 30

[sinks.exec_s3.buffer]
type = "disk"
max_size = 268435488
when_full = "block"

[sinks.exec_s3.acknowledgements]
enabled = true

[sinks.exec_s3.healthcheck]
enabled = false
This config dumps the files captured from the Tetragon logs, adds some additional context such as instance ID and environment variables (e.g. .arena.team), and configures the S3 destination and Vector’s buffering controls. The S3 endpoint configuration is in place because this instance uses IPv6. The logs are compressed in memory and delivered to S3 in ndJSON format.
The buffering logic is as follows:
Vector will flush to S3 upon either of these criteria being met:
- 1 MiB of data
- 30 seconds
If it fails to deliver logs, Vector will keep as much as:
- 256 MiB in storage
ClickHouse Config
ClickHouse has been set up to ingest logs via S3Queue. S3Queue is an:
… engine [that] provides integration with the Amazon S3 ecosystem and allows streaming import.
It basically provides a mechanism to grab logs from S3 and load them into ClickHouse.
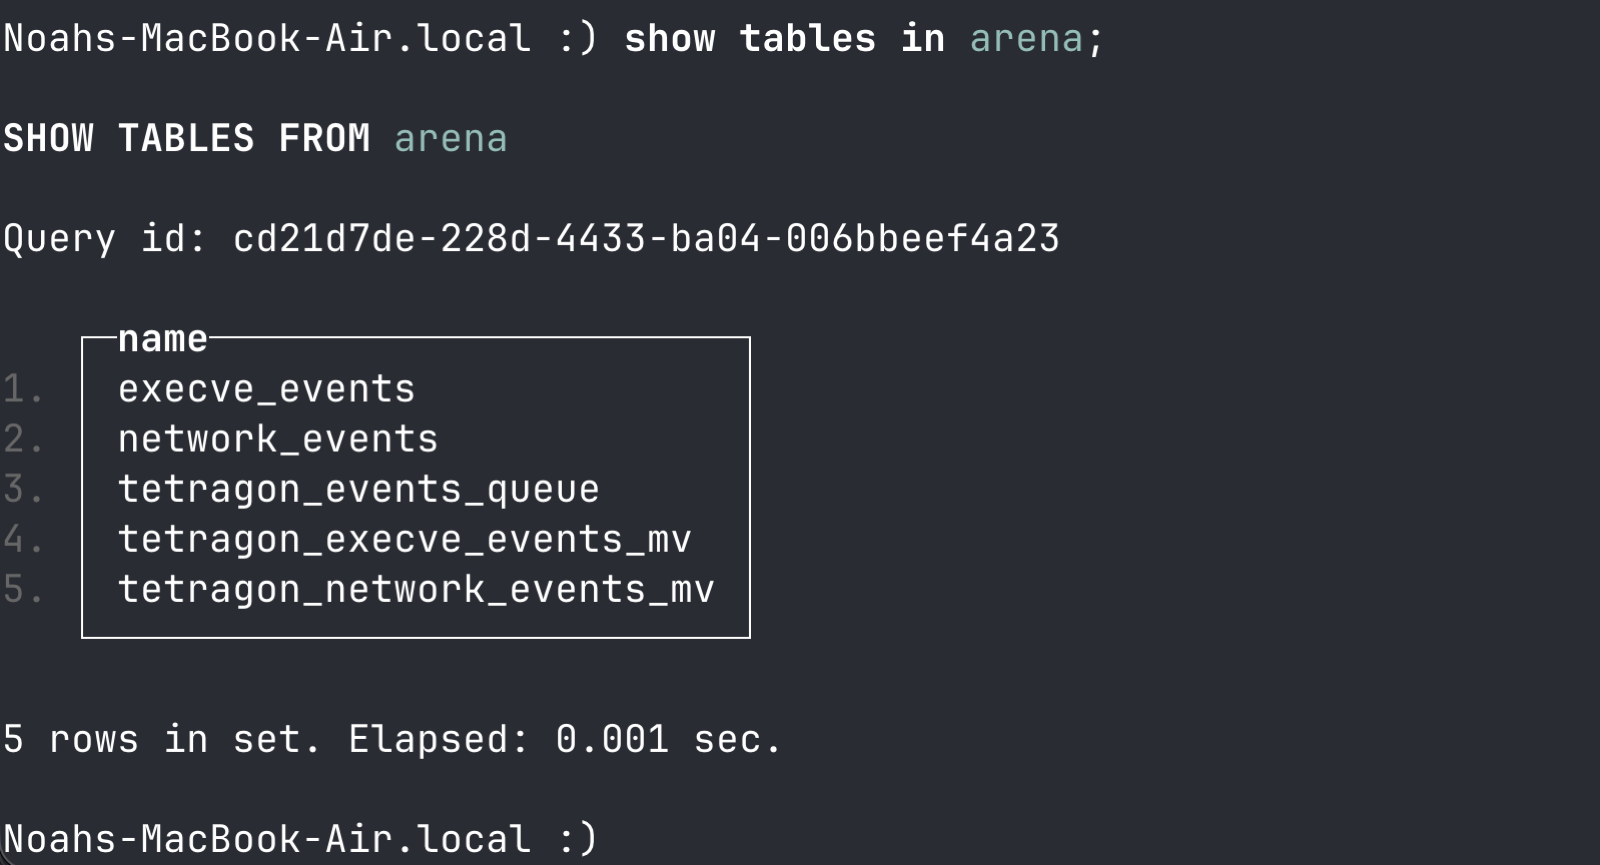
This requires a few moving parts within ClickHouse:
- ClickHouse Keeper: metadata manager for ClickHouse, tracks per-object ingestion, etc.
- Source table: does the JSON extraction from the
.gzfile and labels the JSON objects. - Materialized view: an intermediate step between the S3Queue input and the destination table, doing further extraction and labeling.
- Destination table: the ultimate, searchable table within ClickHouse.
ClickHouse Tetragon Destination Tables
CREATE TABLE IF NOT EXISTS arena.execve_events
(
    event_time       DateTime64(6) CODEC(DoubleDelta, ZSTD(1)),
    environment      LowCardinality(String) CODEC(ZSTD(1)),
    team             LowCardinality(String) CODEC(ZSTD(1)),
    service          LowCardinality(String) CODEC(ZSTD(1)),
    instance_id      LowCardinality(String) CODEC(ZSTD(1)),
    instance_name    LowCardinality(String) CODEC(ZSTD(1)),
    event_name       LowCardinality(String) CODEC(ZSTD(1)),
    host_name        LowCardinality(String) CODEC(ZSTD(1)),
    process_name     LowCardinality(String) CODEC(ZSTD(1)),
    pid              UInt32 CODEC(T64, ZSTD(1)),
    ppid             UInt32 CODEC(T64, ZSTD(1)),
    host_pid         UInt32 CODEC(T64, ZSTD(1)),
    host_ppid        UInt32 CODEC(T64, ZSTD(1)),
    uid              Int64 CODEC(T64, ZSTD(1)),
    audit_loginuid   UInt32 CODEC(T64, ZSTD(1)),
    audit_sessionid  Nullable(UInt32) CODEC(T64, ZSTD(1)),
    process_identity String CODEC(ZSTD(3)),
    parent_process_identity String CODEC(ZSTD(3)),
    return_value     Int64 CODEC(T64, ZSTD(1)),
    pathname         String CODEC(ZSTD(3)),
    arguments        String CODEC(ZSTD(3)),
    argv             Array(String) CODEC(ZSTD(3)),
    raw              String CODEC(ZSTD(6)),
    s3_path          String CODEC(ZSTD(3))
)
ENGINE = MergeTree
PARTITION BY (team, toYYYYMMDD(event_time))
ORDER BY (team, service, instance_id, event_time)
TTL toDateTime(event_time) + INTERVAL 90 DAY;

CREATE TABLE IF NOT EXISTS arena.network_events
(
    event_time       DateTime64(9) CODEC(DoubleDelta, ZSTD(1)),
    environment      LowCardinality(String) CODEC(ZSTD(1)),
    team             LowCardinality(String) CODEC(ZSTD(1)),
    service          LowCardinality(String) CODEC(ZSTD(1)),
    instance_id      LowCardinality(String) CODEC(ZSTD(1)),
    instance_name    LowCardinality(String) CODEC(ZSTD(1)),
    event_name       LowCardinality(String) CODEC(ZSTD(1)),
    tags             Array(LowCardinality(String)) CODEC(ZSTD(1)),
    host_name        LowCardinality(String) CODEC(ZSTD(1)),
    process_name     LowCardinality(String) CODEC(ZSTD(1)),
    process_binary   String CODEC(ZSTD(3)),
    pid              UInt32 CODEC(T64, ZSTD(1)),
    uid              Int64 CODEC(T64, ZSTD(1)),
    audit_loginuid   UInt32 CODEC(T64, ZSTD(1)),
    process_identity String CODEC(ZSTD(3)),
    parent_name      LowCardinality(String) CODEC(ZSTD(1)),
    parent_identity  String CODEC(ZSTD(3)),
    arguments        String CODEC(ZSTD(3)),
    network_arguments String CODEC(ZSTD(3)),
    raw              String CODEC(ZSTD(6)),
    s3_path          String CODEC(ZSTD(3))
)
ENGINE = MergeTree
PARTITION BY (team, toYYYYMMDD(event_time))
ORDER BY (team, service, instance_id, event_time)
TTL toDateTime(event_time) + INTERVAL 90 DAY;
The main concept here is that compression is toggled per column, and that strings which only appear fewer than ~10K distinct values per data part (data parts are also multiple per partition) can take advantage of LowCardinality, which will separately store a dictionary of those values and, when searching, will only traverse those values within the table when doing lookups by replacing them with a small integer index. Nifty!
The partition here is by team and by date. This is the primary lever within ClickHouse for data tiering and TTL (time to live). The ORDER BY statement is how ClickHouse logically segments the granules of data. In my search patterns, it matters to be able to largely sort by team, then service (the EC2 host), then event time. It might matter more to you to search by process executable or PPID, so adjust accordingly.
Note: in this case I’m storing the s3_path and raw columns. This is probably an anti-pattern; I did it purely for debugging purposes.
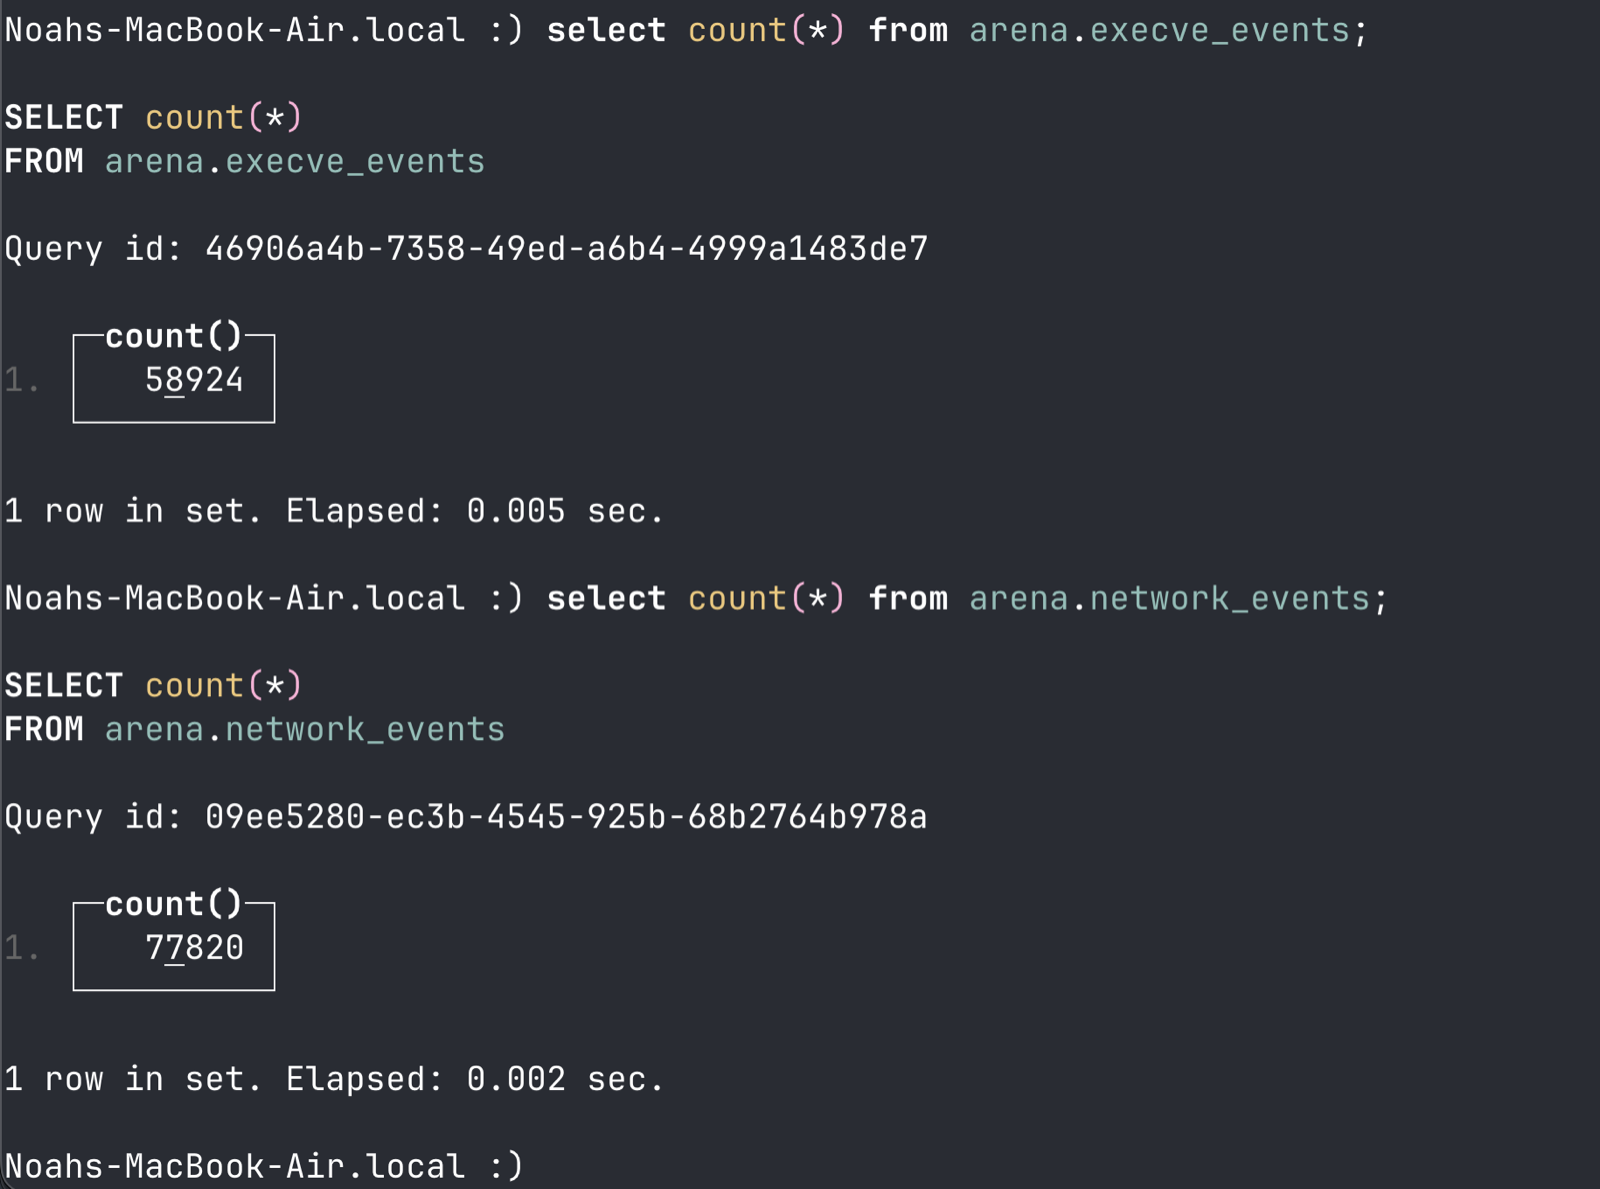
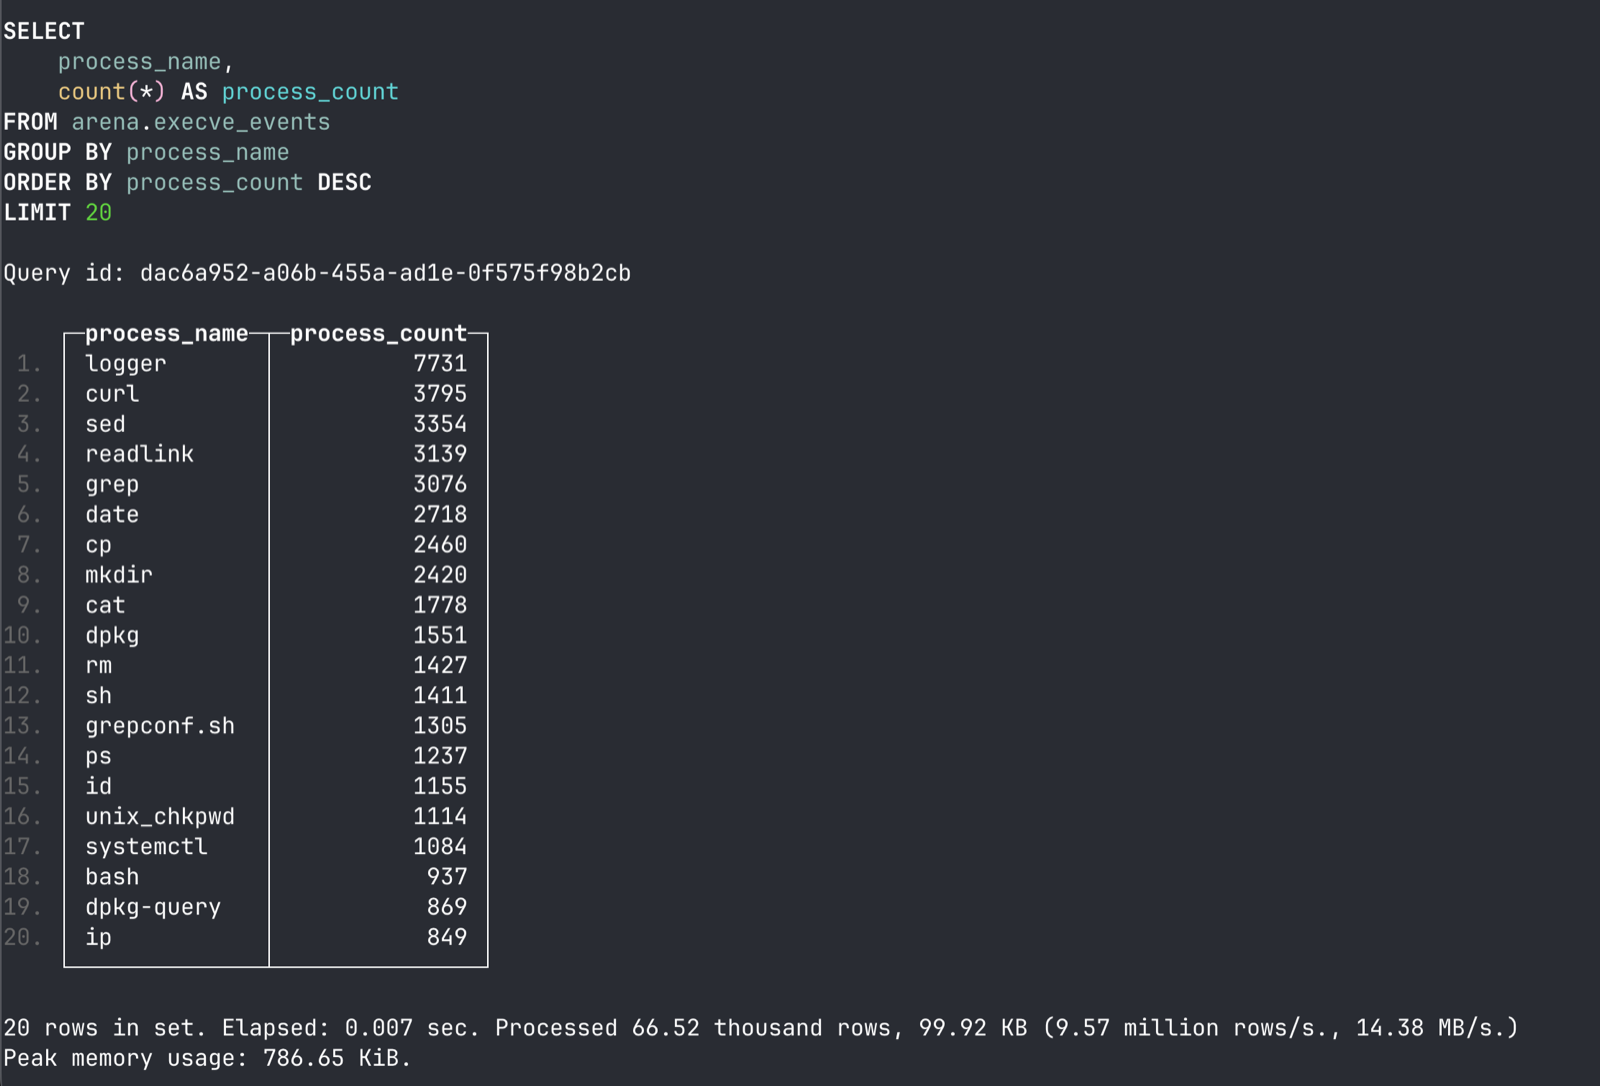
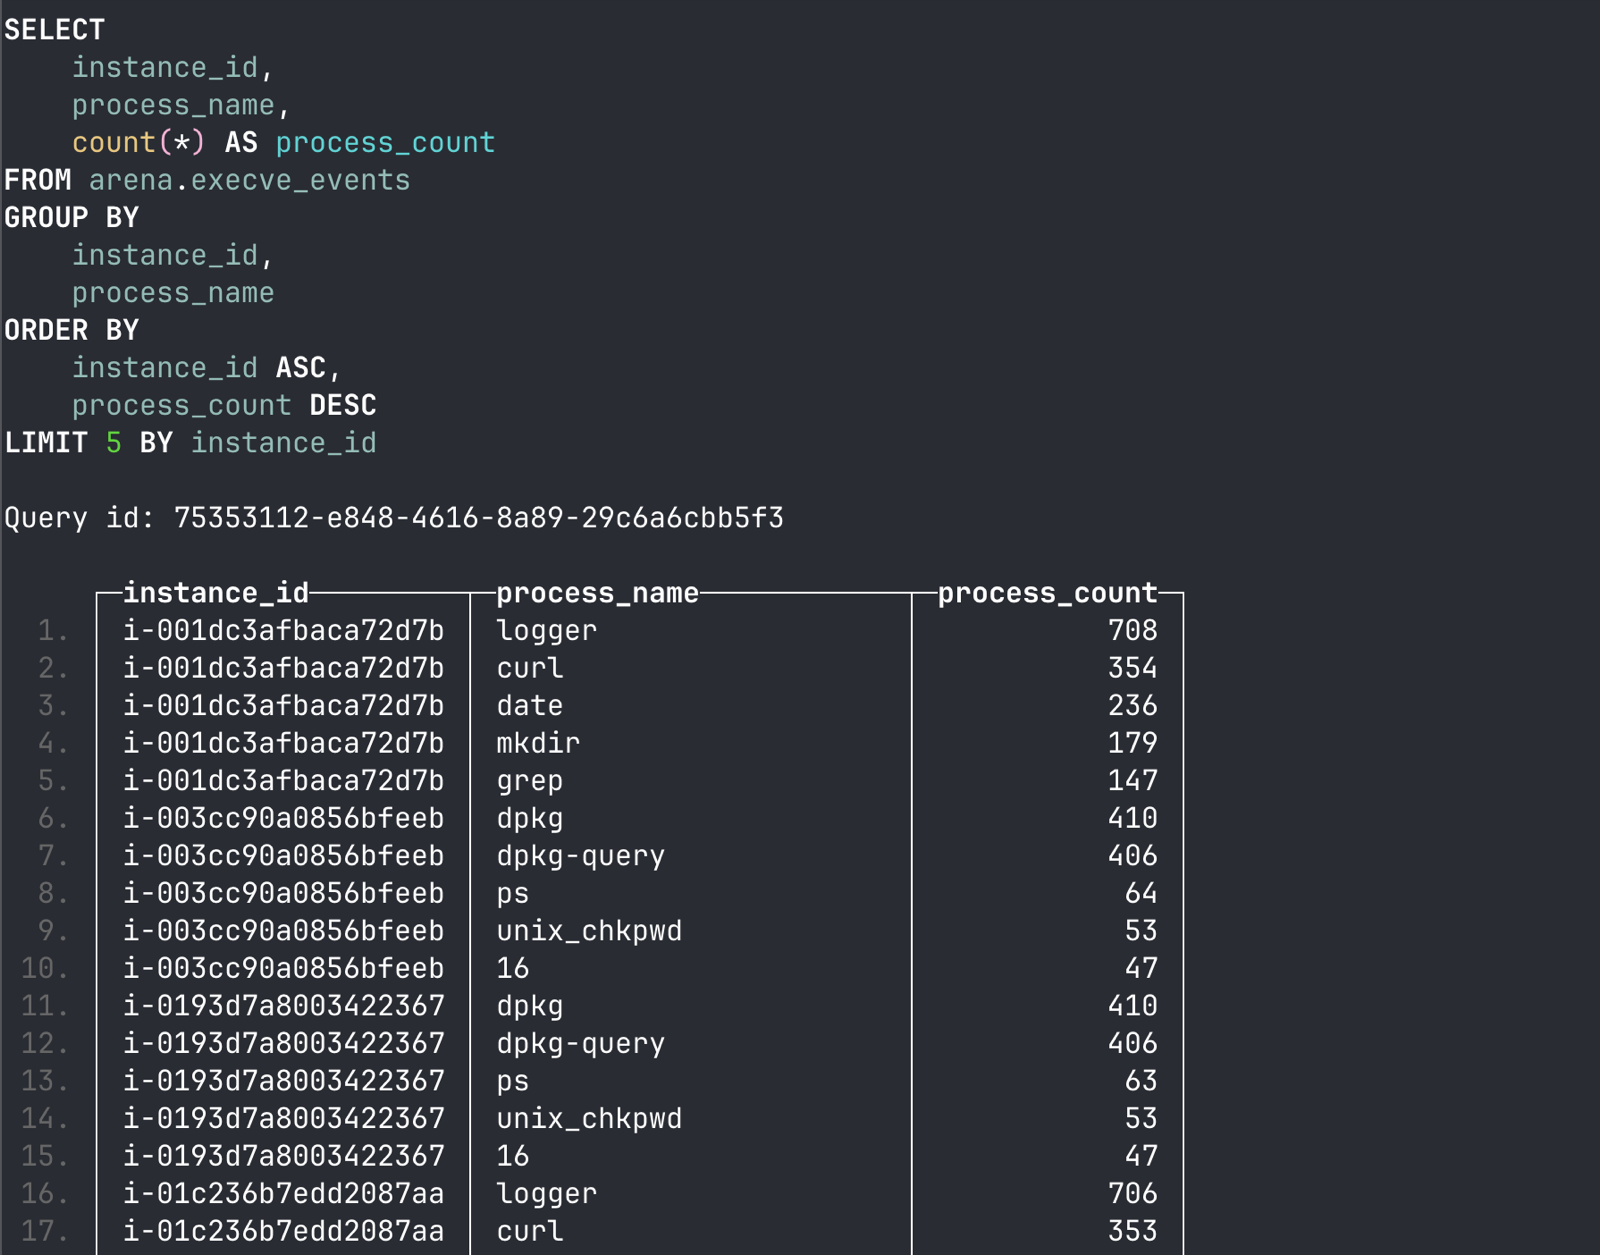
You can see the query for this schema used to search by process name and grab the count.
Finding a WordPress Attack in the Logs
Okay, bear with me, this query is a bit convoluted looking…
WITH RECURSIVE
    descendants AS
    (
        SELECT
            event_time,
            instance_id,
            instance_name,
            process_name,
            pathname,
            arguments,
            uid,
            process_identity,
            parent_process_identity,
            toUInt8(0) AS depth
        FROM arena.execve_events
        WHERE (service = 'wordpress') AND (process_name IN ('php-fpm', 'httpd', 'apache2')) AND (uid NOT IN (0))
        UNION ALL
        SELECT
            child.event_time,
            child.instance_id,
            child.instance_name,
            child.process_name,
            child.pathname,
            child.arguments,
            child.uid,
            child.process_identity,
            child.parent_process_identity,
            parent.depth + 1
        FROM arena.execve_events AS child
        INNER JOIN descendants AS parent ON (child.instance_id = parent.instance_id) AND (child.parent_process_identity = parent.process_identity)
        WHERE (parent.depth < 10) AND (child.process_identity != child.parent_process_identity)
    )
SELECT
    depth,
    event_time,
    instance_name,
    process_name,
    pathname,
    arguments,
    uid
FROM descendants
WHERE depth > 0
ORDER BY
    instance_name ASC,
    event_time ASC,
    depth ASC
The goal of this query is to find commands run by the WordPress parent services (php-fpm, httpd, apache2) and see if any child processes have been spawned off.
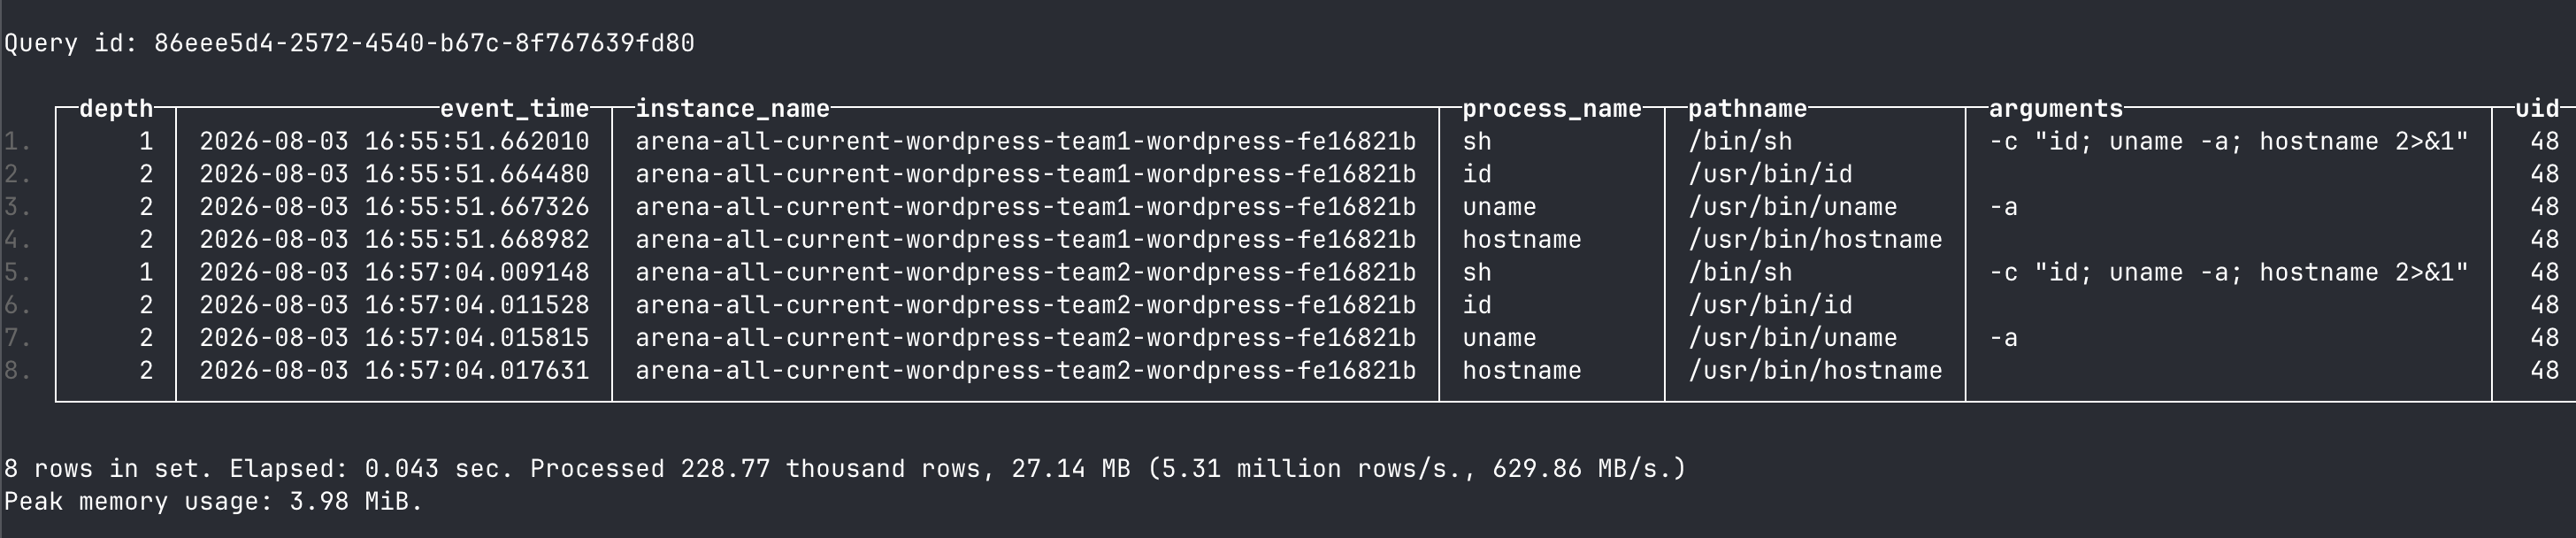
The result is clear: it did run child processes such as /bin/sh or /usr/bin/id, which would not be normal for WordPress to call.
Hopefully this post was helpful! More content to follow soon.