 noahmagill.com
 ownCloud Infinite Scale (oCIS) Tracing and RUM with OpenObserve
ownCloud Infinite Scale is a modern replacement for ownCloud, the legacy PHP file server.
Welcome to oCIS, the modern file-sync and share platform, which is based on our knowledge and experience with the PHP based ownCloud server.
It is a complete redesign focused on micro services, queueing, and a complete code-rewrite in Go. Simply put, it’s a modern alternative to PHP file servers that has quite a bit of niceties such as tracing.
oCIS supports k8s as well, see the ocis-charts repo. For this example we will be using Docker.
Moving Parts:
| Tool | Purpose |
|---|---|
| oCIS Docker | modern file system written in Go |
| nginx | proxy to support JS injection needed for RUM |
| otel-collector | grabs gRPC otel events from oCIS, exports them to OpenObserve collector endpoints |
| OpenObserve | modern Rust observability stack in a single binary |
All of this is done in Docker.
OpenObserve: what is this?
OpenObserve was a semi-recent GitHub project find of mine. It is a really cool project that aims to offer up to 50x cost savings compared to Elasticsearch, Datadog, and other similar observability tooling. It is built in Rust, centered around Apache DataFusion, OTEL, Apache Parquet, and object storage.
Links:
- OpenObserve
- openobserve/openobserve on GitHub
It has a moderately sized community on GitHub with over 20K stars as of the time of this writing. They also have a very competitively priced hosted option as well. For this walk-through we are using the community edition and are self-hosting it. For the self-hosted pricing there is no cost associated with it except for the storage and compute which is an insane deal in 2026.
Setup
My Docker Compose is as following:
services:
  openobserve:
    image: openobserve/openobserve:latest
    platform: linux/arm64
    container_name: openobserve
    restart: unless-stopped
    environment:
      ZO_ROOT_USER_EMAIL: ${ZO_ROOT_USER_EMAIL}
      ZO_ROOT_USER_PASSWORD: ${ZO_ROOT_USER_PASSWORD}
      ZO_CORS_ALLOWED_ORIGINS: https://${OCIS_HOSTNAME}:${NGINX_HTTPS_PORT}
    ports:
      - "5080:5080"
    volumes:
      - openobserve_data:/data

  otel-collector:
    image: otel/opentelemetry-collector-contrib:latest
    platform: linux/arm64
    container_name: otel-collector
    restart: unless-stopped
    depends_on:
      - openobserve
    volumes:
      - ./otel-collector/config.yaml:/etc/otelcol-contrib/config.yaml:ro
    command: ["--config=/etc/otelcol-contrib/config.yaml"]

  ocis:
    image: owncloud/ocis:latest
    platform: linux/arm64
    container_name: ocis
    restart: unless-stopped
    depends_on:
      - otel-collector
    entrypoint:
      - /bin/sh
      - -c
      - "ocis init --insecure yes 2>/dev/null; exec ocis server"
    environment:
      OCIS_URL: https://${OCIS_HOSTNAME}:${NGINX_HTTPS_PORT}
      PROXY_HTTP_ADDR: 0.0.0.0:9200
      PROXY_TLS: "false"
      OCIS_INSECURE: "true"
      PROXY_ENABLE_BASIC_AUTH: "true"
      ADMIN_PASSWORD: ${OCIS_ADMIN_PASSWORD}
      OCIS_TRACING_ENABLED: "true"
      OCIS_TRACING_TYPE: otlp
      OCIS_TRACING_ENDPOINT: otel-collector:4317
      OCIS_LOG_LEVEL: info
    volumes:
      - ocis_config:/etc/ocis
      - ocis_data:/var/lib/ocis

  nginx:
    image: nginx:alpine
    container_name: ocis-nginx
    restart: unless-stopped
    depends_on:
      - ocis
    ports:
      - "${NGINX_HTTPS_PORT}:${NGINX_HTTPS_PORT}"
    volumes:
      - ./nginx/conf.d:/etc/nginx/conf.d:ro
      - ./certs:/etc/nginx/certs:ro
      - ./nginx/rum-assets:/etc/nginx/rum-assets:ro
    networks:
      default:
        aliases:
          - ${OCIS_HOSTNAME}

volumes:
  openobserve_data:
  ocis_config:
  ocis_data:
OTEL Collector Config
The reason for the OTEL collector to begin with is that oCIS just supports outputting OTEL traces to gRPC and has no way of adding an auth header which OpenObserve requires. In their official docs they want you to use Jaeger which is another cloud native tracing framework built on OTEL. In this case we just use the OTEL collector to forward to OpenObserve. Here is the config sample:
receivers:
  otlp:
    protocols:
      grpc:
        endpoint: 0.0.0.0:4317
      http:
        endpoint: 0.0.0.0:4318

processors:
  batch: {}

exporters:
  otlphttp/openobserve:
    endpoint: http://openobserve:5080/api/default
    headers:
      Authorization: "Basic cGFzc3dvcmQxMjMK"

service:
  pipelines:
    traces:
      receivers: [otlp]
      processors: [batch]
      exporters: [otlphttp/openobserve]
oCIS Config
This block of config was already pasted above in the Docker config but I’ll paste it again for verbosity. This website is pretty authoritative regarding the config options and is well maintained upon releases. The main points below are just the tracking being enabled, pointed at the svc dns of the otel-collector in the Docker stack, and that http(s) has been disabled and to trust the proxy. I found that info log setting was verbose enough for me.
environment:
      OCIS_URL: https://${OCIS_HOSTNAME}:${NGINX_HTTPS_PORT}
      PROXY_HTTP_ADDR: 0.0.0.0:9200
      PROXY_TLS: "false"
      OCIS_INSECURE: "true"
      PROXY_ENABLE_BASIC_AUTH: "true"
      ADMIN_PASSWORD: ${OCIS_ADMIN_PASSWORD}
      OCIS_TRACING_ENABLED: "true"
      OCIS_TRACING_TYPE: otlp
      OCIS_TRACING_ENDPOINT: otel-collector:4317
      OCIS_LOG_LEVEL: info
nginx Config
Okay this is where it gets a little schizo. Basically the RUM (real user monitoring) feature in OpenObserve requires JS to be injected into the served content. Since oCIS is a compiled Go binary, I did not feel like re-compiling it to include the needed JS files, so I injected it at the proxy level, in this case nginx. There are some CSP items in here as well, those need to be adjusted accordingly per domain.
map $http_upgrade $connection_upgrade {
    default upgrade;
    ''      close;
}

server {
    listen 8443 ssl;
    server_name ocis.local;

    ssl_certificate     /etc/nginx/certs/ocis.crt;
    ssl_certificate_key /etc/nginx/certs/ocis.key;
    ssl_protocols TLSv1.2 TLSv1.3;

    client_max_body_size 0;

    # Self-hosted RUM SDK bundles, served same-origin so they satisfy ocis's script-src 'self' CSP.
    location /rum-assets/ {
        alias /etc/nginx/rum-assets/;
        add_header Cache-Control "no-cache";
    }

    # Proxy RUM ingestion same-origin/HTTPS: the SDK would otherwise call OpenObserve directly over
    # plain http://localhost:5080, which Safari (unlike Chrome) blocks as mixed content on an https page.
    location /rum/ {
        proxy_pass http://openobserve:5080/rum/;
        proxy_set_header Host $http_host;
    }

    location / {
        proxy_pass http://ocis:9200;
        proxy_http_version 1.1;

        proxy_set_header Host $http_host;
        proxy_set_header X-Real-IP $remote_addr;
        proxy_set_header X-Forwarded-For $proxy_add_x_forwarded_for;
        proxy_set_header X-Forwarded-Proto $scheme;
        proxy_set_header X-Forwarded-Host $host;

        proxy_set_header Upgrade $http_upgrade;
        proxy_set_header Connection $connection_upgrade;

        # sub_filter can't rewrite compressed bodies, so ask ocis for uncompressed HTML.
        proxy_set_header Accept-Encoding "";

        # ocis's CSP has no worker-src, so Worker creation falls back to child-src 'self' (no blob:).
        # The RUM SDK's session-replay recorder spins up a compression worker from a blob: URL, which
        # that fallback blocks; add worker-src explicitly so it's the only change to ocis's policy.
        proxy_hide_header Content-Security-Policy;
        add_header Content-Security-Policy "child-src 'self'; connect-src 'self' blob: https://raw.githubusercontent.com/owncloud/awesome-ocis/; default-src 'none'; font-src 'self'; frame-ancestors 'self'; frame-src 'self' blob: https://embed.diagrams.net/; img-src 'self' data: blob: https://raw.githubusercontent.com/owncloud/awesome-ocis/; manifest-src 'self'; media-src 'self'; object-src 'self' blob:; script-src 'self' 'unsafe-inline'; style-src 'self' 'unsafe-inline'; worker-src 'self' blob:" always;

        sub_filter_once on;
        sub_filter_types text/html;
        sub_filter '</head>' '<script src="/rum-assets/openobserve-rum.js"></script><script src="/rum-assets/openobserve-logs.js"></script><script>(function(){var options={clientToken:"rumsorBELb4WJnw2jts",applicationId:"ocis-web",site:"ocis.local:8443",service:"ocis-web",env:"development",version:"1.0.0",organizationIdentifier:"default",insecureHTTP:false,apiVersion:"v1"};OO_RUM.init({applicationId:options.applicationId,clientToken:options.clientToken,site:options.site,organizationIdentifier:options.organizationIdentifier,service:options.service,env:options.env,version:options.version,trackResources:true,trackLongTasks:true,trackUserInteractions:true,apiVersion:options.apiVersion,insecureHTTP:options.insecureHTTP,defaultPrivacyLevel:"allow",allowedTracingUrls:[{match:"https://ocis.local:8443",propagatorTypes:["tracecontext"]}],sessionSampleRate:100,sessionReplaySampleRate:100});OO_LOGS.init({clientToken:options.clientToken,site:options.site,organizationIdentifier:options.organizationIdentifier,service:options.service,env:options.env,version:options.version,forwardErrorsToLogs:true,insecureHTTP:options.insecureHTTP,apiVersion:options.apiVersion});OO_RUM.startSessionReplayRecording();})();</script></head>';
    }
}
You do need a client secret (clientToken) that you can find in the OpenObserve panel in RUM icon on the left bar when you first click into it. This janky snippet of bash did the rendering for me to place it into the nginx config and into the directory it knows how to serve from.
echo "==> Fetching OpenObserve RUM SDK bundles (if missing)"
mkdir -p nginx/rum-assets/chunks
if [[ ! -f nginx/rum-assets/openobserve-rum.js ]]; then
  curl -sL "https://unpkg.com/@openobserve/browser-rum@${RUM_SDK_VERSION}/bundle/openobserve-rum.js" \
    -o nginx/rum-assets/openobserve-rum.js
fi
if [[ ! -f nginx/rum-assets/openobserve-logs.js ]]; then
  curl -sL "https://unpkg.com/@openobserve/browser-logs@${RUM_SDK_VERSION}/bundle/openobserve-logs.js" \
    -o nginx/rum-assets/openobserve-logs.js
fi
# The RUM SDK lazy-loads session-replay recorder chunks from bundle/chunks/ at runtime.
RUM_CHUNKS="profiler-da8b374510b8838a8938-openobserve-rum.js recorder-f4f0f1d89a0eadca1e0f-openobserve-rum.js"
for f in $RUM_CHUNKS; do
  if [[ ! -f "nginx/rum-assets/chunks/$f" ]]; then
    curl -sL "https://unpkg.com/@openobserve/browser-rum@${RUM_SDK_VERSION}/bundle/chunks/$f" \
      -o "nginx/rum-assets/chunks/$f"
  fi
done

echo "==> Rendering nginx config"
sed \
  -e "s/__OCIS_HOSTNAME__/${OCIS_HOSTNAME}/g" \
  -e "s/__NGINX_HTTPS_PORT__/${NGINX_HTTPS_PORT}/g" \
  -e "s/__OCIS_RUM_CLIENT_TOKEN__/${OCIS_RUM_CLIENT_TOKEN}/g" \
  -e "s|__OCIS_RUM_SITE__|${OCIS_RUM_SITE}|g" \
  -e "s/__OCIS_RUM_ORG__/${ZO_ORG}/g" \
  -e "s/__OCIS_RUM_INSECURE__/${OCIS_RUM_INSECURE}/g" \
  -e "s|__OCIS_URL__|https://${OCIS_HOSTNAME}:${NGINX_HTTPS_PORT}|g" \
  nginx/conf.d/ocis.conf.tmpl > nginx/conf.d/ocis.conf
Observing Traces within OpenObserve
The UI feels quite mature within OpenObserve for viewing traces.
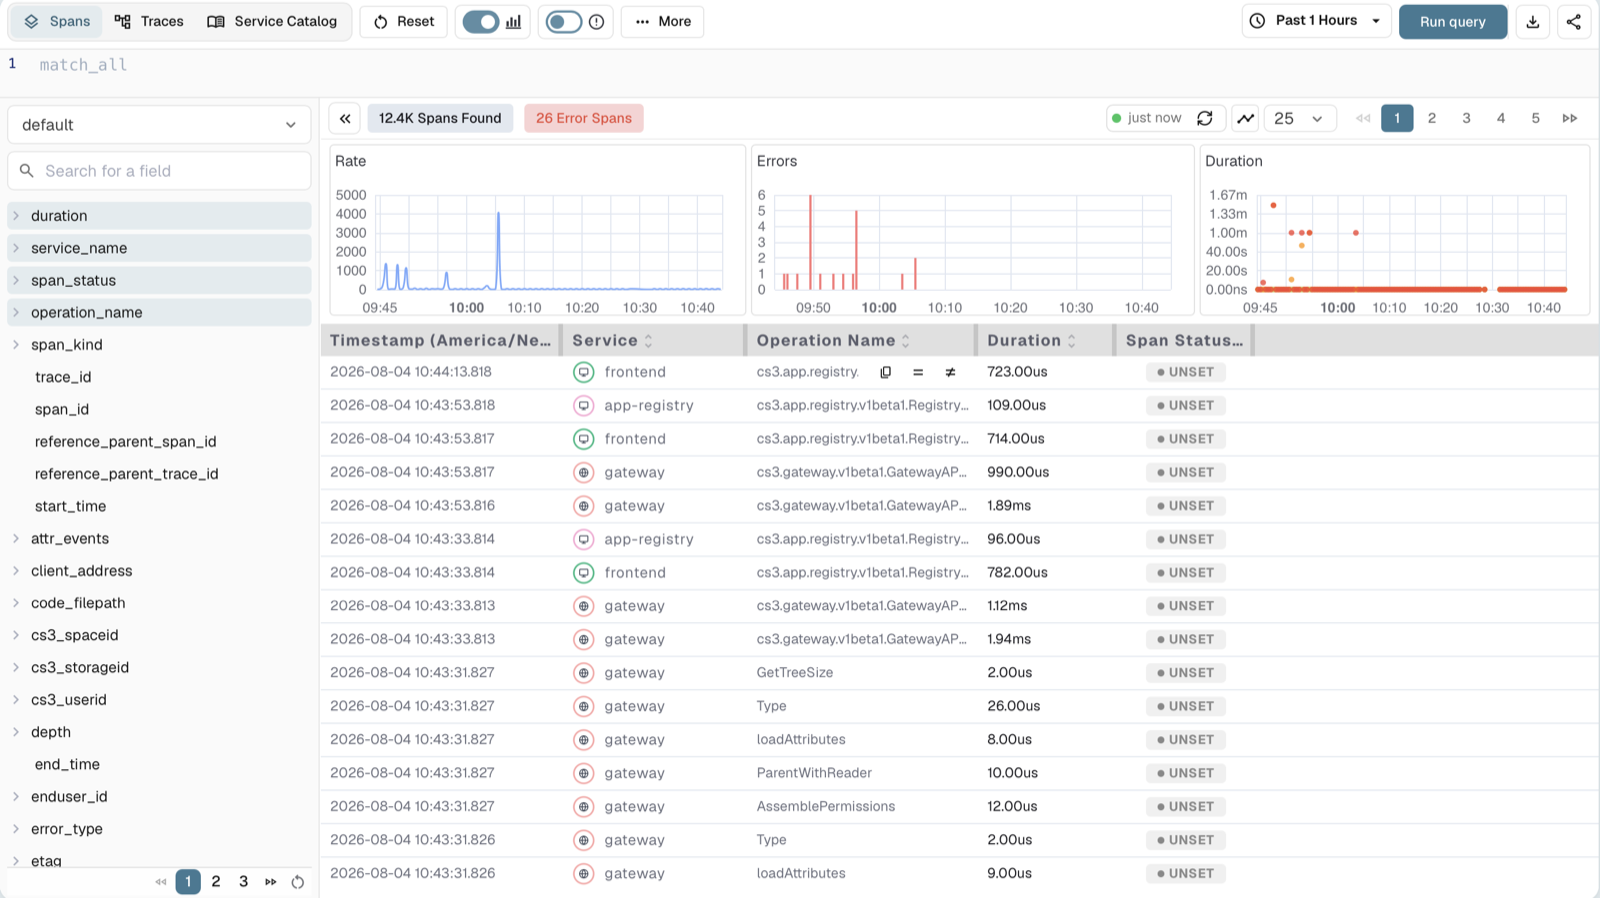
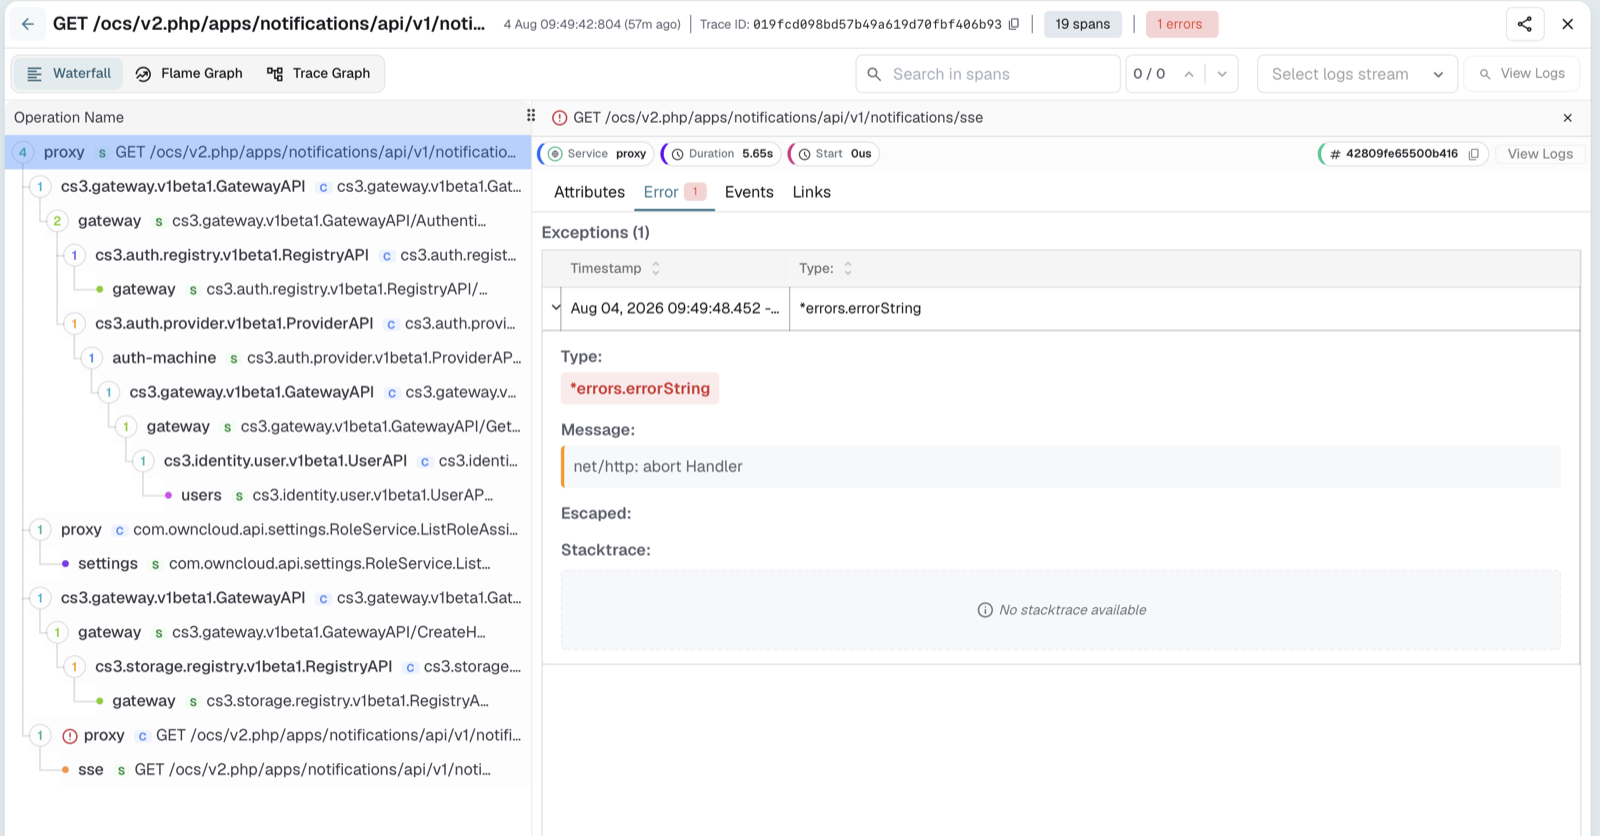
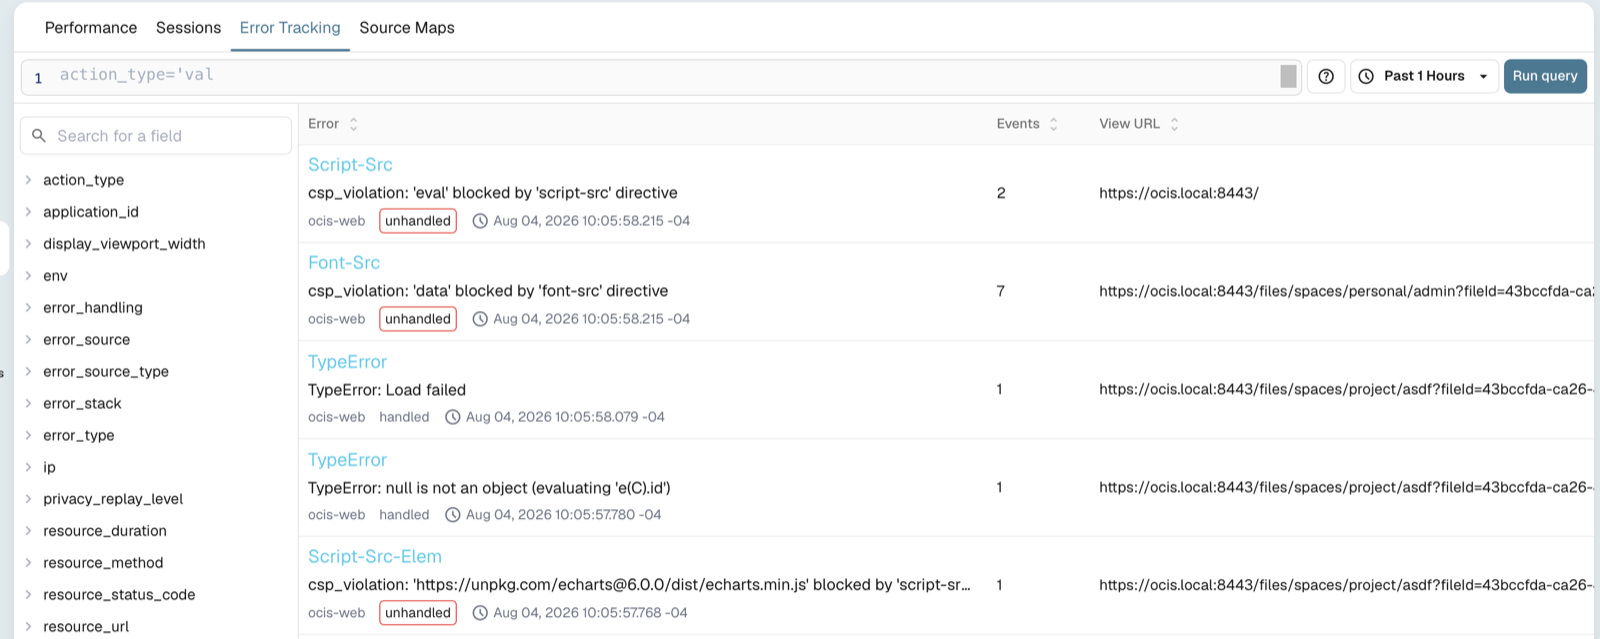
I have some error traces right away since I did not know how CSPs worked, apparently lol.
Here is an example of clicking into a trace during a login check:
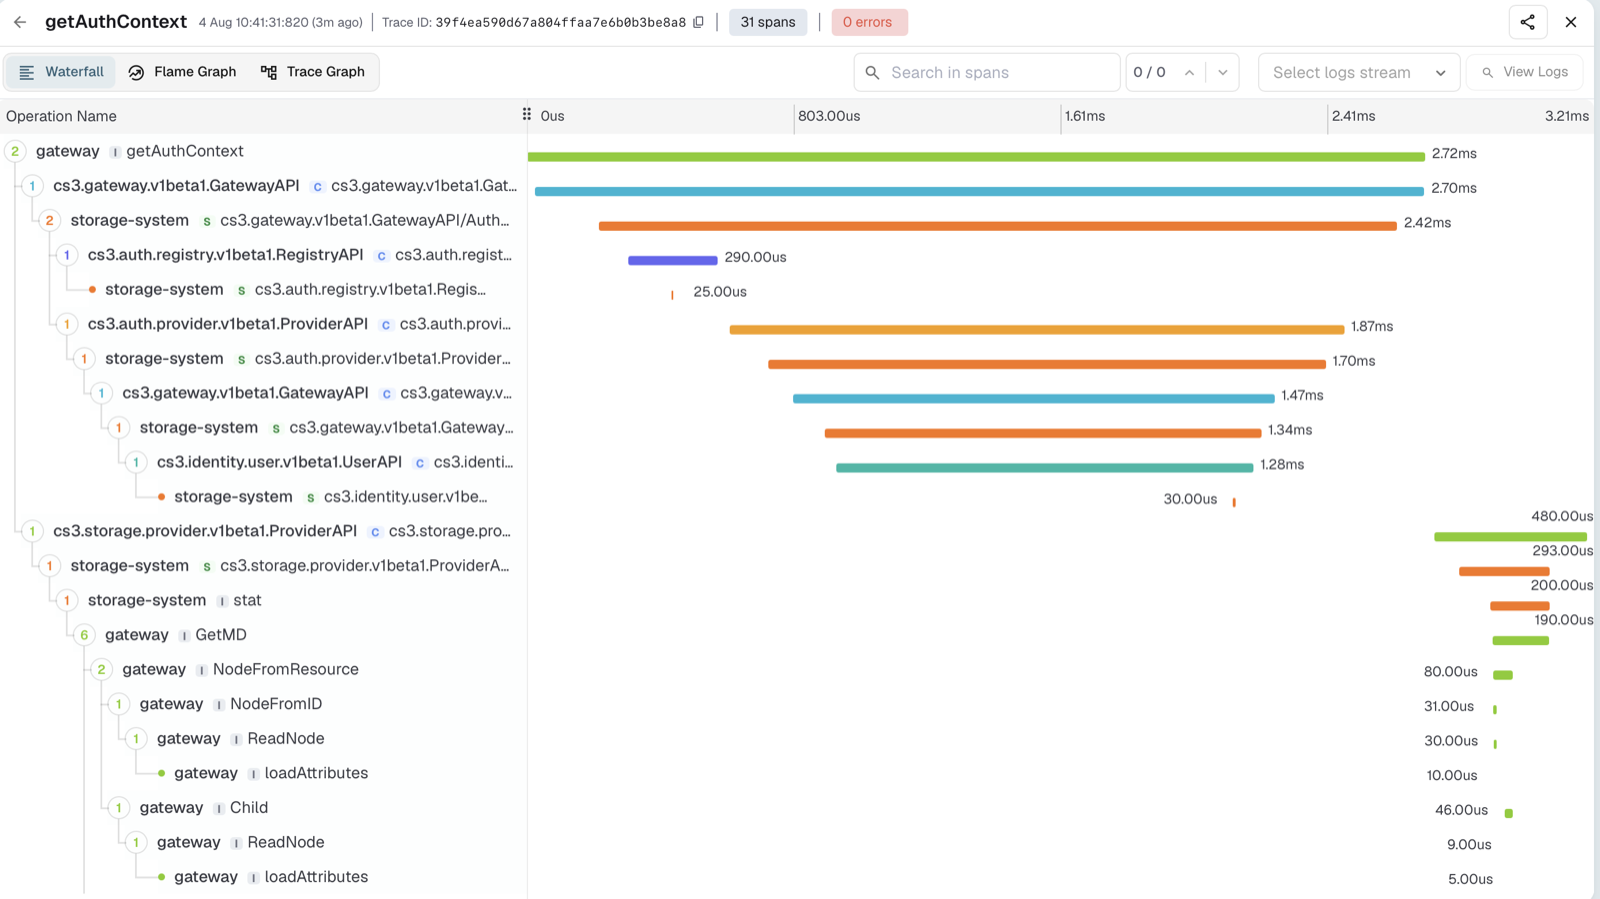
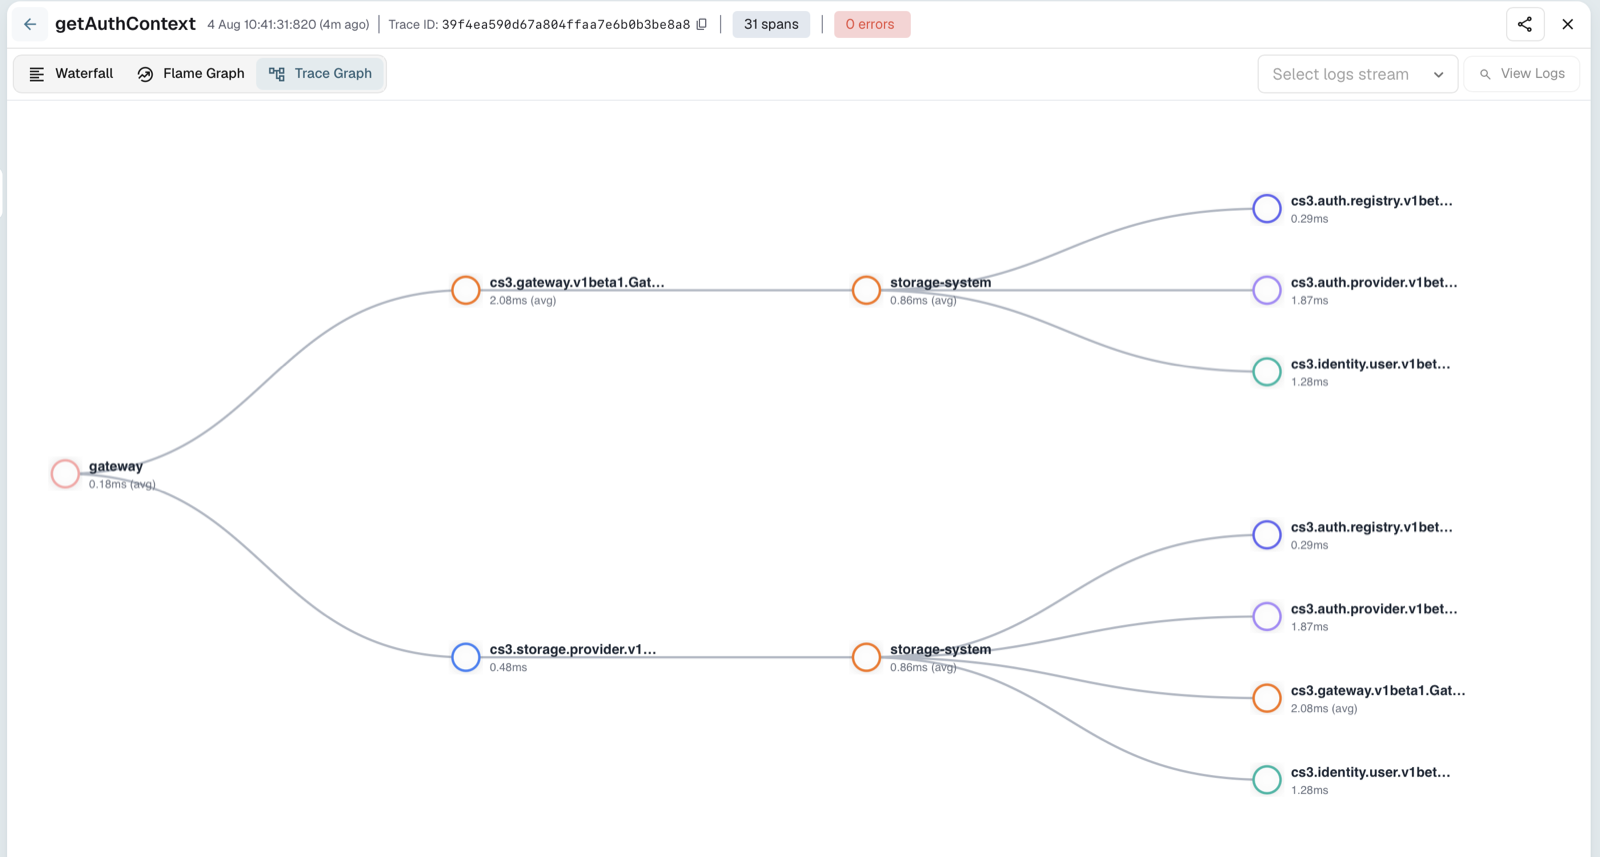
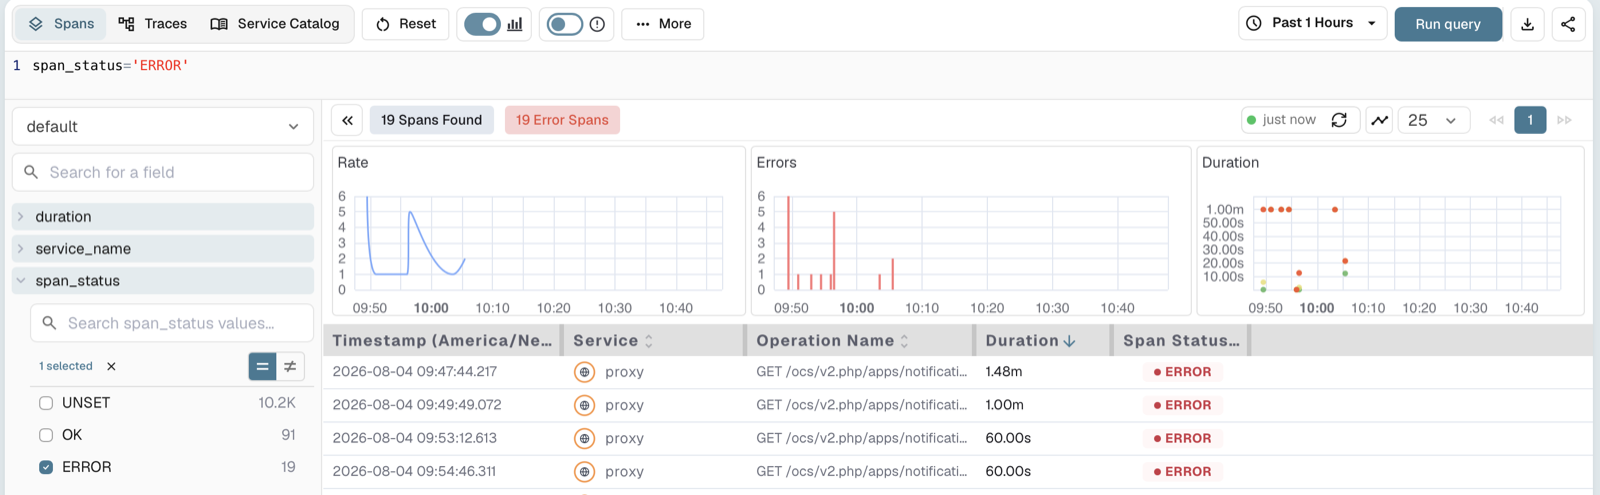
They have more nifty views for visualization. Filtering for errors is very easy to do:
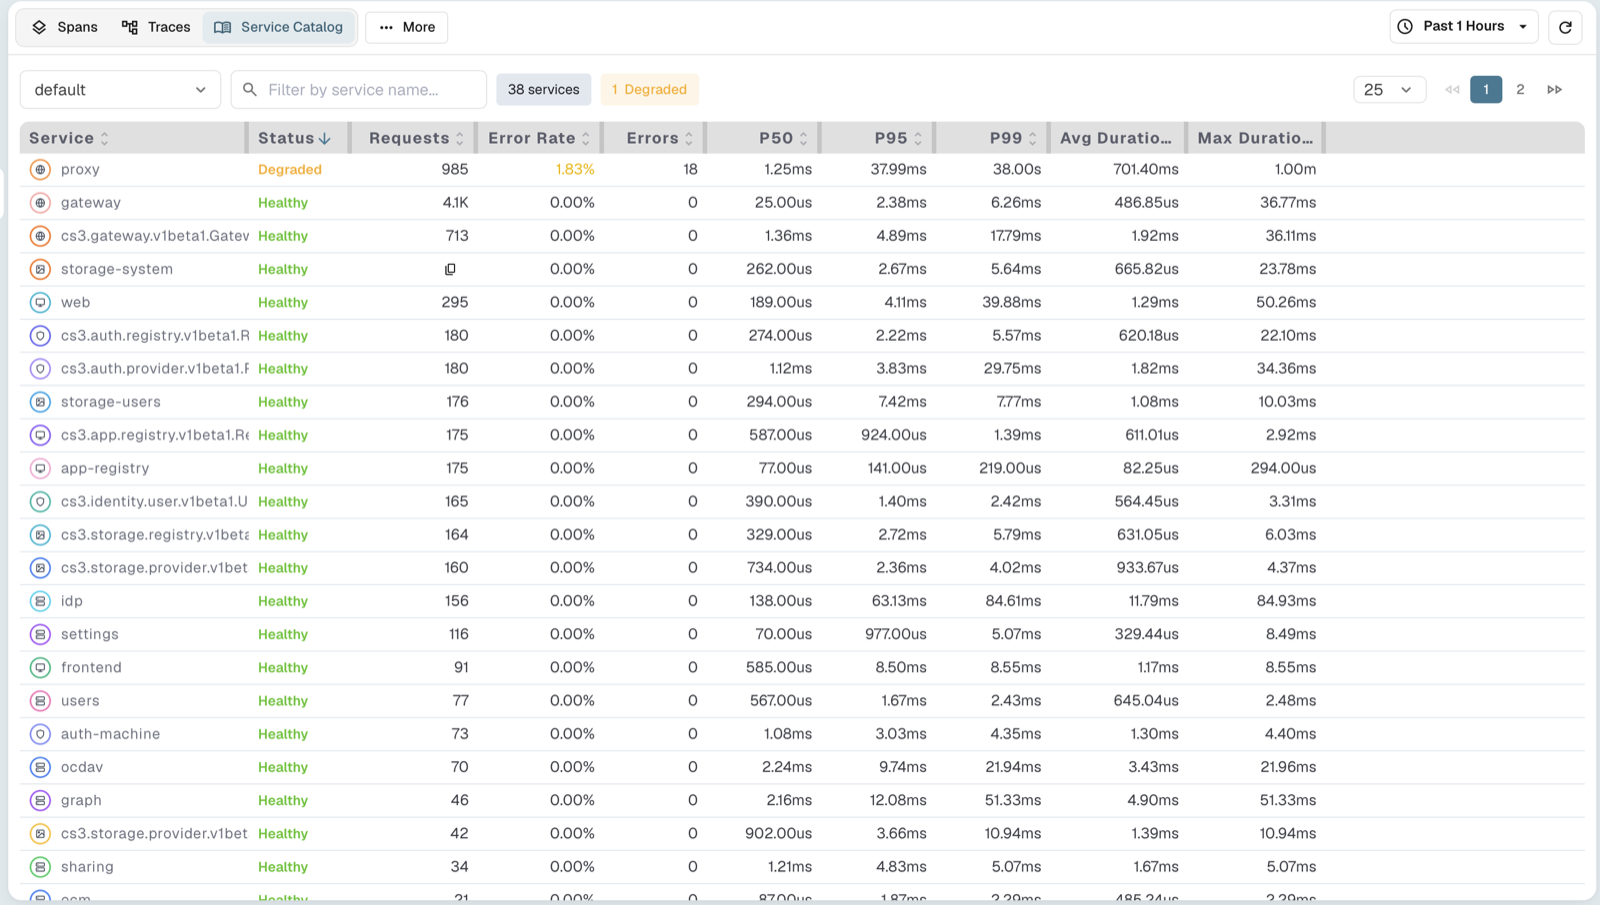
Their service catalog option is nice as well, allows you to display all the various service providers and consumers:
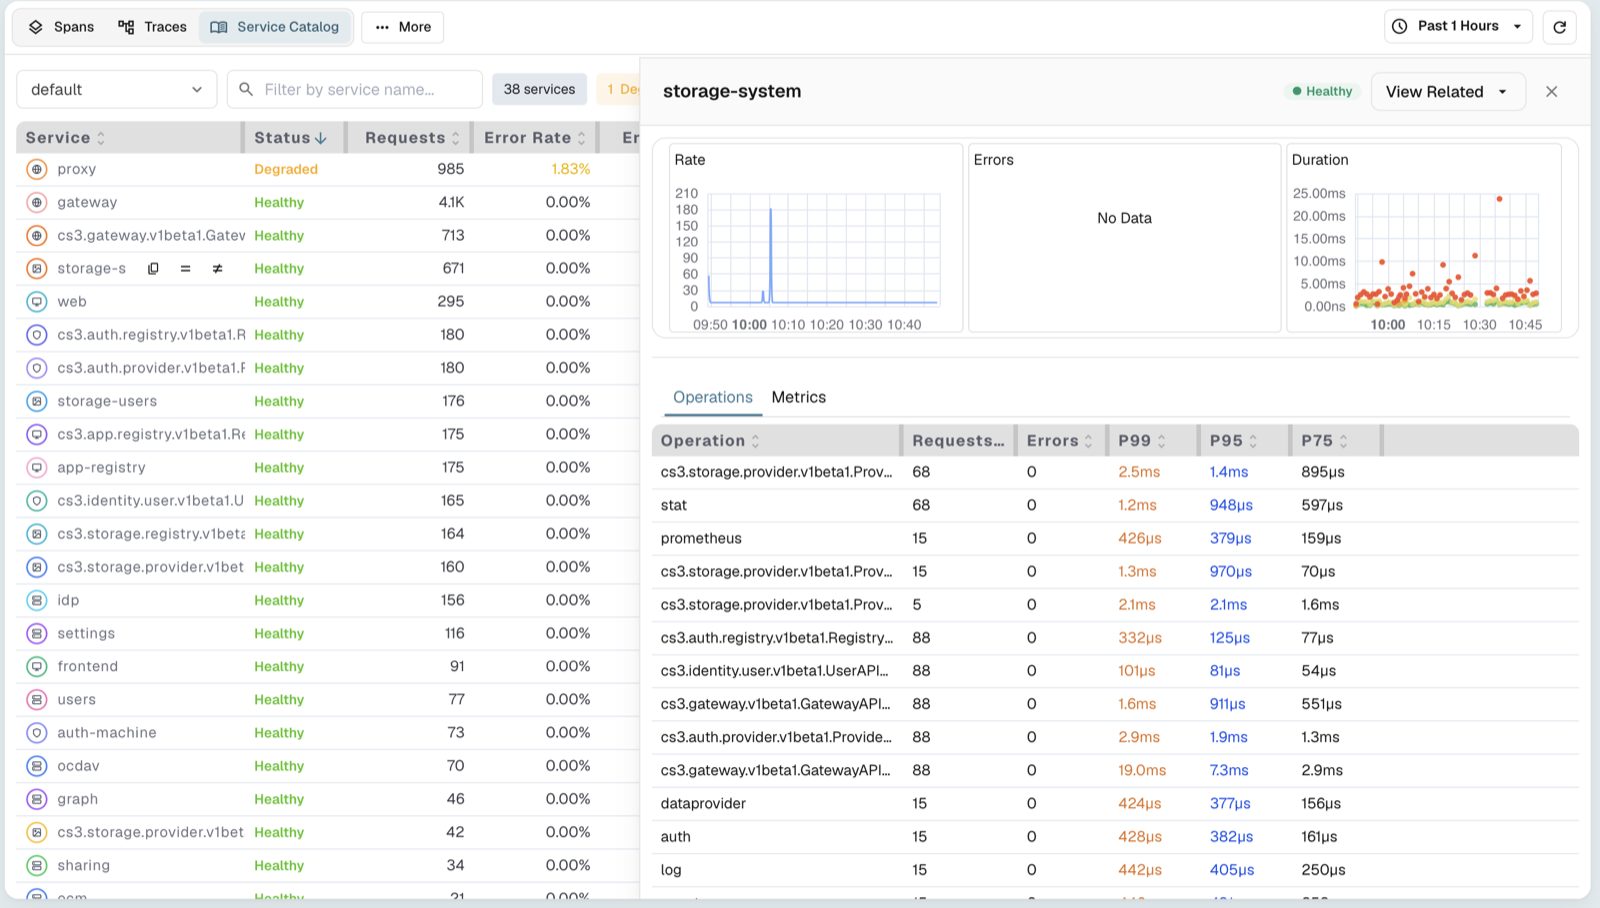
Drilling into a service:
Viewing RUM Sessions within OpenObserve
This is where it gets really valuable. Most RUM tools are very costly and do not scale well price-wise when your user base grows, often forcing you to configure your sampling percentage to be very tiny. A solution like this could be inclusive to the requirement of capturing all traces/sessions as needed and then configuring lifecycle policies to retire sessions/traces that do not meet certain criteria.
Here is a short demo of me viewing a user (me lol) logging into oCIS and poking around:
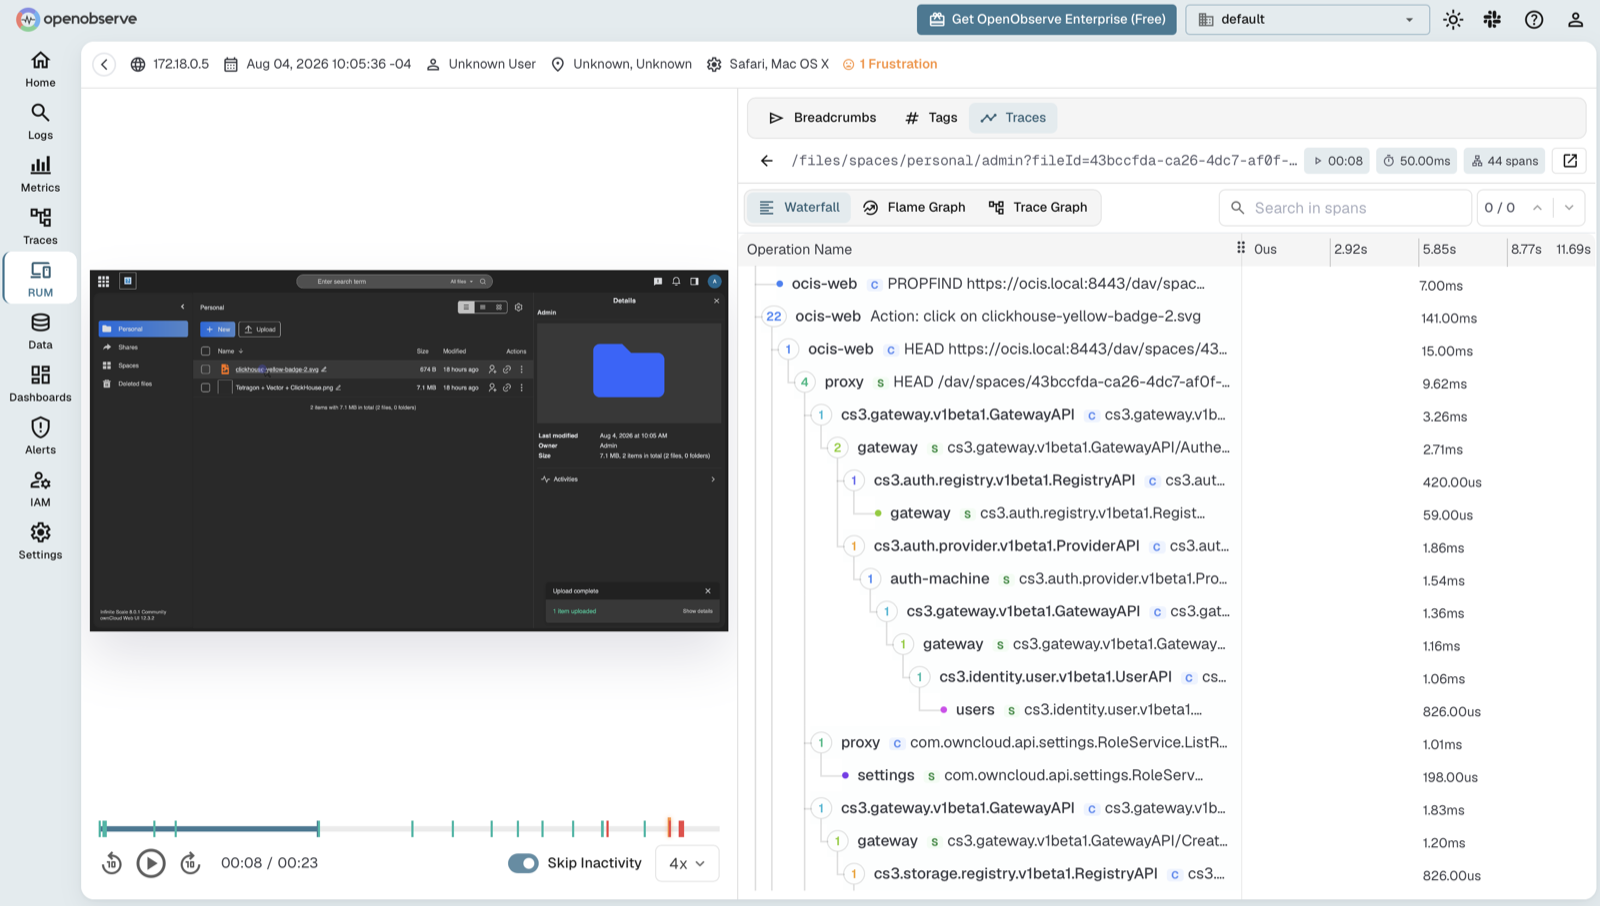
The UI is quite intuitive, and shows all my actions within the oCIS UI, and any traces that correlate to clicks/etc. Super nice for triaging a user complaint and seeing the exact flow.
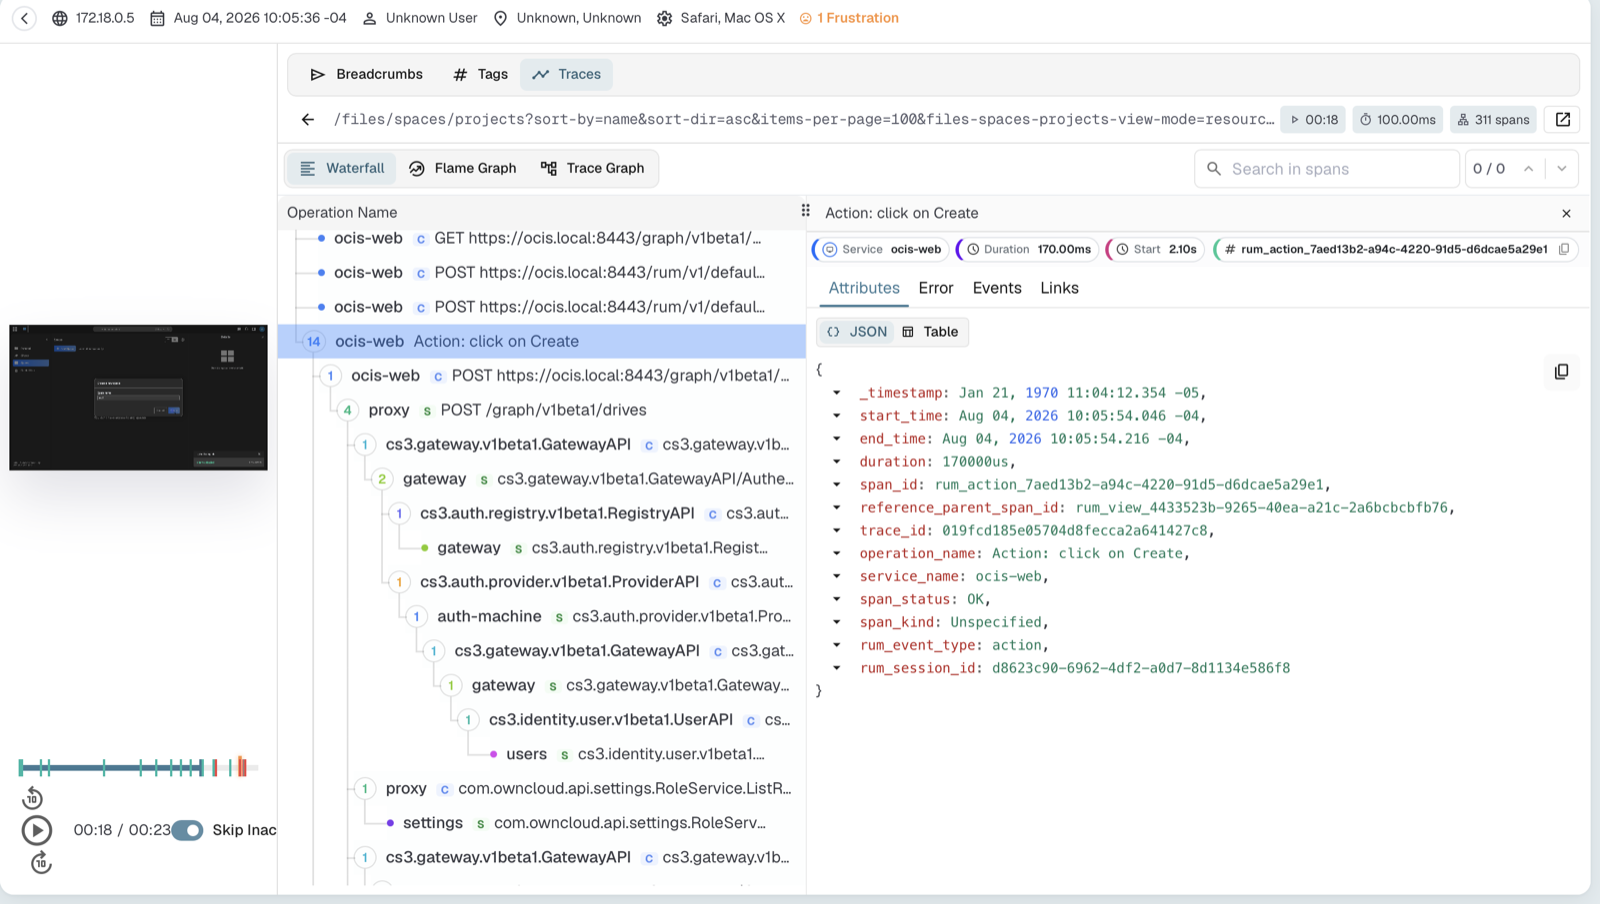
You can see in the above screenshot that when I clicked “create a space” (oCIS version of “drives”) that it automatically correlated all of the traces with that button click and all the internal providers responding to the various micro service requests.
Here you can see all of the errors if any are associated during a RUM capture.
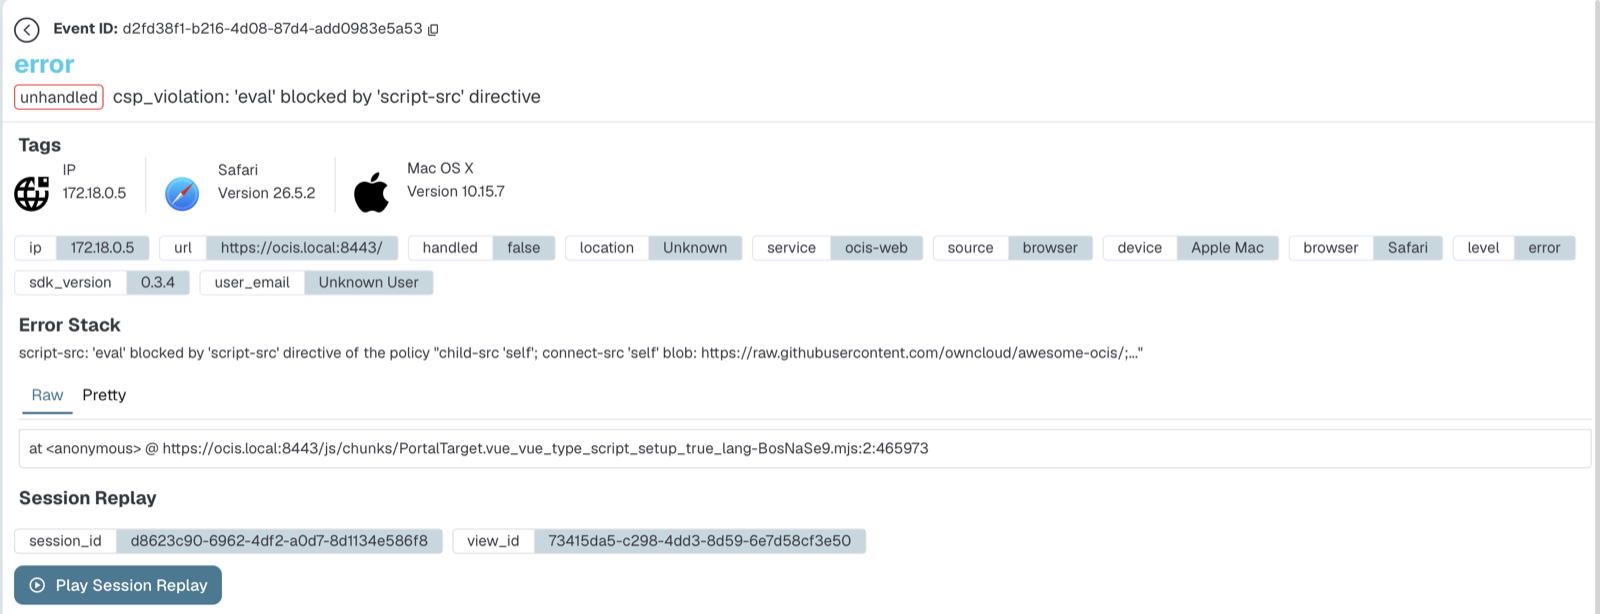
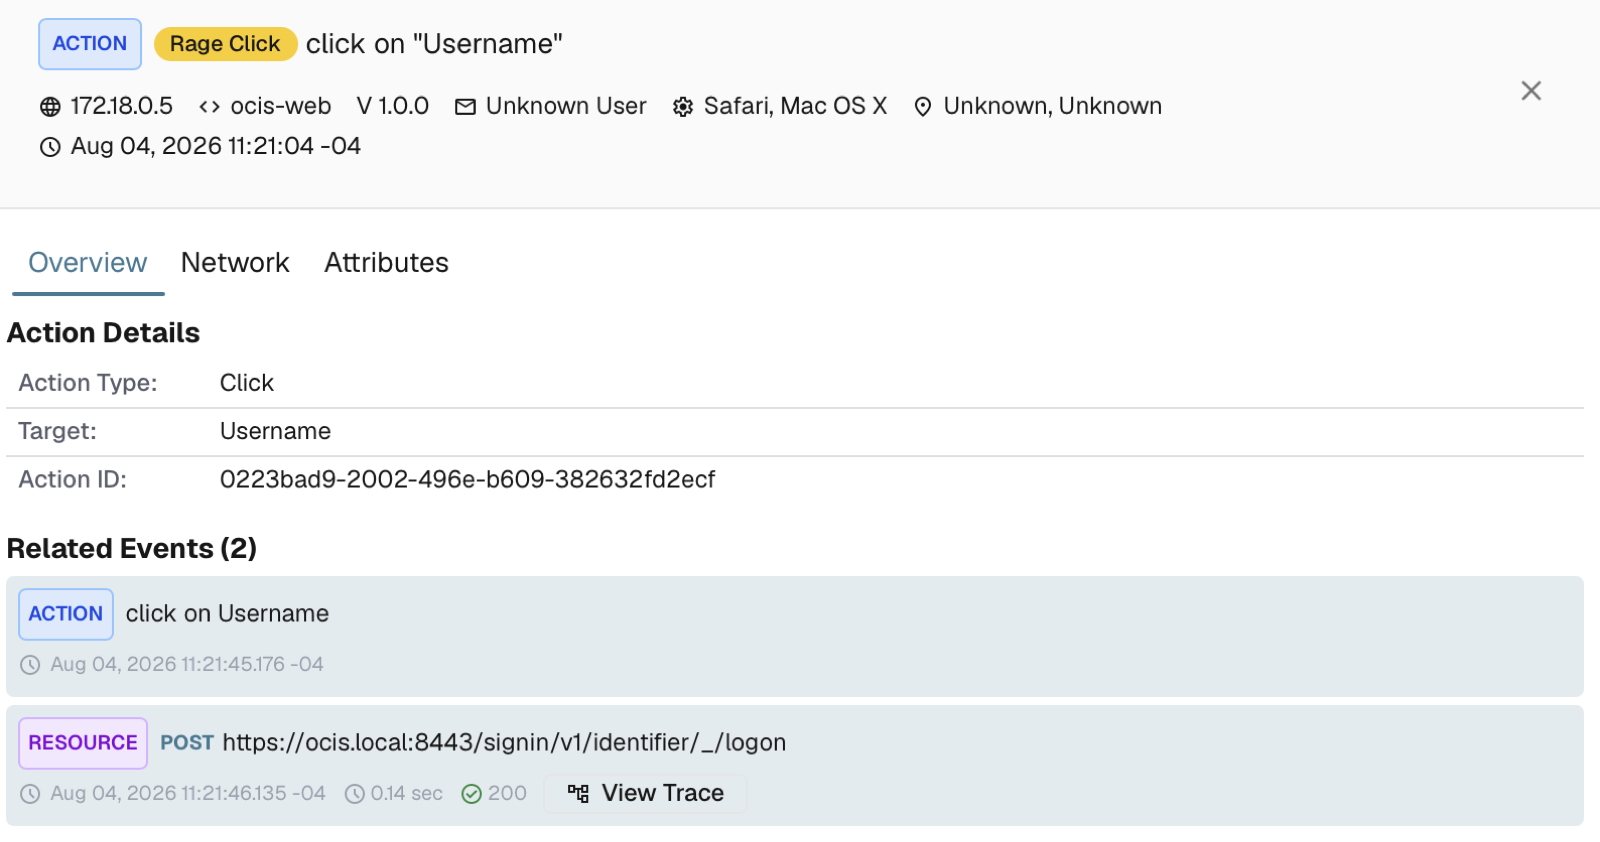
Here is a funny example of OpenObserving thinking that I rage clicked a button…
Adding additional attributes to traces/RUM
I got tired of seeing “Unknown User” so I did a bit of diving into how I could get that field to populate correctly.
By adding this snippet of JS into the nginx config alongside the RUM injection I could obtain the user email by interacting with the Graph API.
var identified = false;
var identifyPoll = setInterval(function() {
  if (identified) return;
  var key = Object.keys(localStorage).find(k => k.indexOf("oc_oAuth.user") === 0);
  if (!key) return;                          // not logged in yet — keep polling
  var stored = JSON.parse(localStorage.getItem(key));
  if (!stored || !stored.access_token) return;
  fetch("/graph/v1.0/me", { headers: { Authorization: "Bearer " + stored.access_token } })
    .then(r => r.ok ? r.json() : null)
    .then(me => {
      if (!me) return;
      identified = true;
      clearInterval(identifyPoll);
      OO_RUM.setUser({ id: me.id, name: me.displayName, email: me.mail });
    });
}, 2000);
This polled until the login identity is established, and then stored the email. This is probably not a great production-grade idea, simply because you are polling and generating errors, and anything holding the email in code is not a great idea. But for this demo, it works.
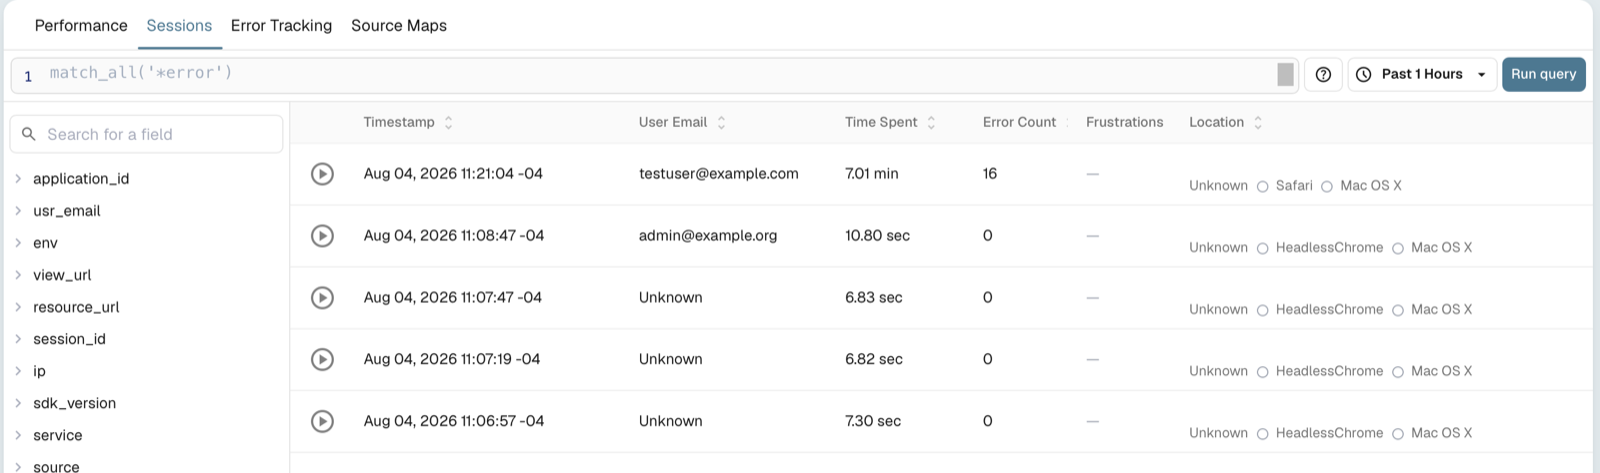
After adding that, the email appears during actions.
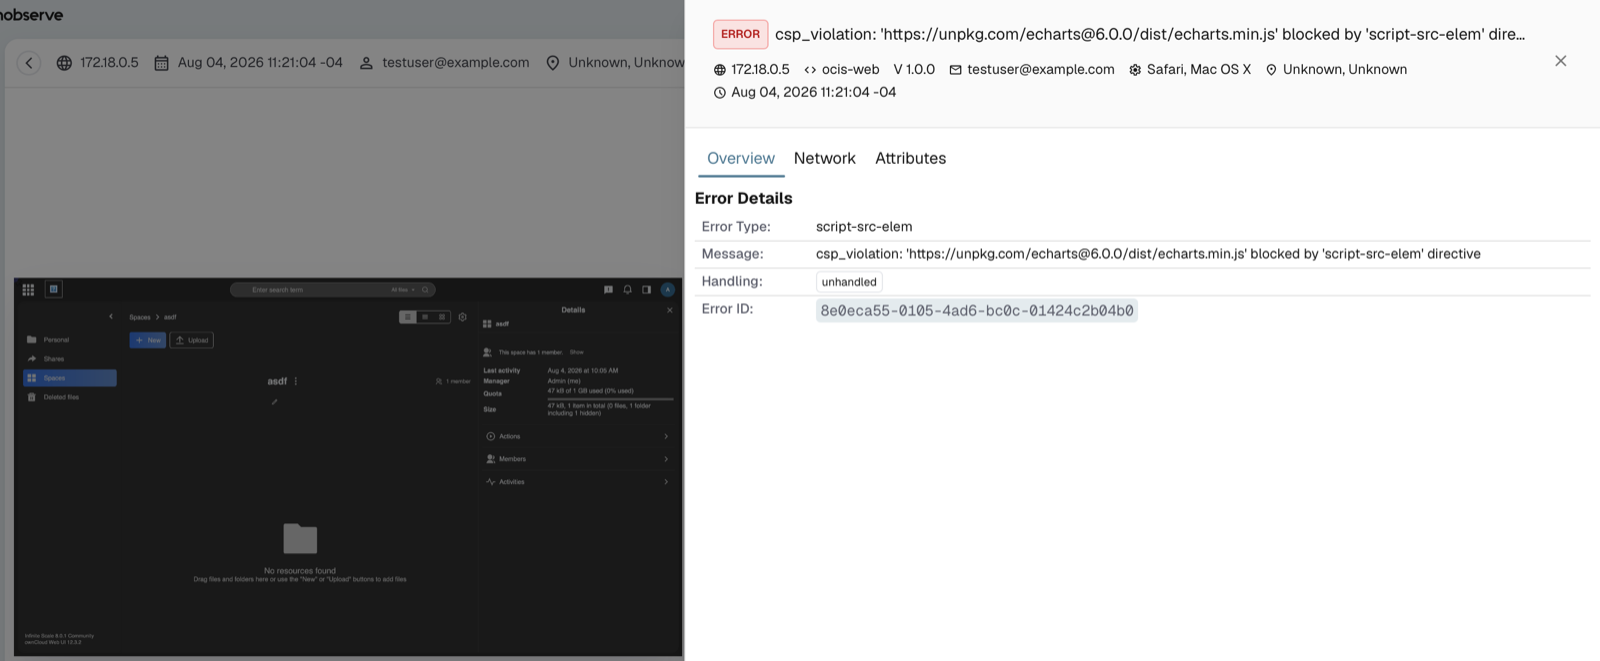
Errors populate correctly with the user’s email. If your service was geolocation-specific, you could add that metadata as well.
RUM / Tracing Costs in OpenObserve
As the title states, this can be done for literally the cost of an S3 bucket. Combined with a service such as Backblaze B2, this would be essentially free. The compute required to host OpenObserve is very small as it was written in Rust and is very performant. See Bring Your Own Bucket for more.
Storing it on a burstable t4g.large AWS instance would probably suffice for thousands of users, and even more if sampling was enabled. Here is the data from my small test instance:
| Data stream | What it holds | Record count | Uncompressed | Compressed on disk | Index size | Compression ratio |
|---|---|---|---|---|---|---|
default (traces) | Backend spans (proxy/graph/gateway/settings/storage) | 55,804 spans (6,823 distinct traces) | 38.6 MB | 2.46 MB | 0.83 MB | ~16:1 |
_rumdata | RUM events (views, resources, actions, errors) | 8,028 events (28 sessions) | 17.3 MB | 0.88 MB | — | ~20:1 |
_sessionreplay | Compressed session-replay segments | 208 segments (14 sessions, 1,813 inner events) | 34.9 MB | 2.62 MB | — | ~13:1 |
_rumlog | Errors forwarded from RUM → Logs | 56 log lines | 0.12 MB | 0.075 MB | 0.03 MB | ~1.5:1 |
trace_list_index | Internal trace-ID index (metadata) | 55,711 | 6.7 MB | 0.29 MB | 0.64 MB | — |
distinct_values_traces_default | Internal field-cardinality index (metadata) | 19,190 | 2.3 MB | 0.07 MB | 0.23 MB | — |
As you can see the compression is amazing.
Versions used in this example
| Component | Image / package | Version actually running |
|---|---|---|
| ocis | owncloud/ocis:latest | Infinite Scale 8.0.1 Community (IDP/Konnect 8.0.1) |
| ocis web frontend | (bundled in ocis image) | ownCloud Web UI 12.3.2 |
| OpenObserve | openobserve/openobserve:latest | v0.91.1 |
| nginx | nginx:alpine | nginx/1.31.3 |
| OTel Collector | otel/opentelemetry-collector-contrib:latest | v0.157.0 |
| RUM SDK (browser) | @openobserve/browser-rum | 0.3.4 |
| RUM logs SDK (browser) | @openobserve/browser-logs | 0.3.4 |
| Docker Engine (host) | — | 29.7.1 (client), 29.5.2 (server, via colima) |
| Docker Compose (host) | — | 5.4.0 |
Thanks for the read!